

Look at the table of quantities below and sketch the isoquants implied by the data for the
Question:
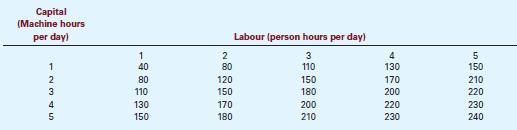
Look at the table of quantities below and sketch the isoquants implied by the data for the output levels Q 5110, Q 5150 and Q 5180. On your graph, put capital on the vertical axis and labour on the horizontal axis.
Step by Step Answer:

This question has not been answered yet.
You can Ask your question!
Related Book For 

Question Posted:
