

The following diagram illustrates the demand and marginal revenue curves facing a monopoly in an industry with
Question:
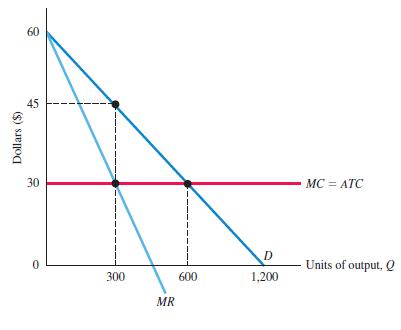
The following diagram illustrates the demand and marginal revenue curves facing a monopoly in an industry with no economies or diseconomies of scale. In the short and long run, MC = ATC.
a. Calculate the values of profit, consumer surplus, and deadweight loss, and illustrate these on the graph.
b. Repeat the calculations in part a, but now assume the monopoly is able to practice perfect price discrimination.
Fantastic news! We've Found the answer you've been seeking!
Step by Step Answer:
Certainly Lets analyze the diagram for a monopoly with no economies or diseconomies of scale Ill pro...View the full answer

Answered By
Nandana Wijayarathna
I am a highly experienced writer in several areas,
Business management
Information technology
Business administration
Literature
Biology
Environmental science
History
161+ Reviews
399+ Question Solved
Related Book For 

Principles Of Economics
ISBN: 9781292294698
13th Global Edition
Authors: Karl E. Case, Ray C. Fair, Sharon E. Oster
Question Posted:
