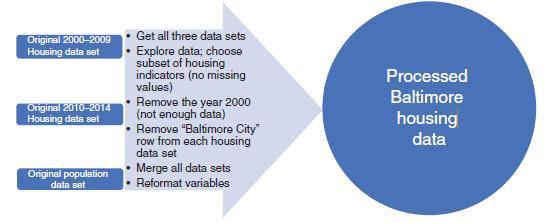
In the textbook companion site, access the motion chart for the Baltimore housing data. Set the x
Question:
In the textbook companion site, access the motion chart for the Baltimore housing data. Set the x axis to “% of Housing Units that are Owner-Occupied” and the y axis to “% of Residential Properties Vacant.”
 a) What was the 2001 “% of Housing Units that are Owner-Occupied” in the Lauraville community?
b) What was the 2001 “% of Residential Properties Vacant” in the Lauraville community?
c) What was the 2010 population in the Lauraville community?
d) What was the 2014 “% of Residential Properties Vacant” in the Lauraville community?
Fantastic news! We've Found the answer you've been seeking!
Step by Step Answer:
Related Book For 

Principles Of Managerial Statistics And Data Science
ISBN: 9781119486411
1st Edition
Authors: Roberto Rivera
Question Posted:


