

Question: Returning to the data set canadaemplmntdata from Problem 17.4, get a line chart of Accommodation jobs by subsetting by VECTOR = v81682. Problem 17.4 The
Returning to the data set “canadaemplmntdata” from Problem 17.4, get a line chart of Accommodation jobs by subsetting by VECTOR = v81682.
Problem 17.4
The file “canadaemplmntdata” contains quarterly Canada employment data for multiple job sectors. The variable name is VALUE, and it is measured in thousands. With computer software assistance, get a chart similar to Figure 17.3 by subsetting the data by VECTOR = v81673.
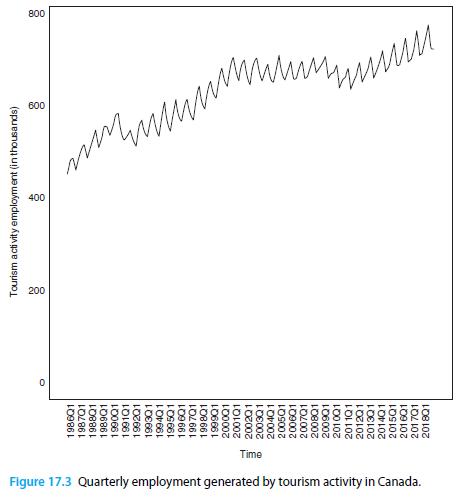
Figure 17.3 Quarterly employment generated by tourism activity in Canada. Time 1986Q1 1987Q1 1988Q1 1989Q1 1990Q1 1991Q1 1992Q1 1993Q1 1994Q1 1995Q1 1996Q1 1997Q1 1998Q1 1999Q1 200001 2001Q1 2002Q1 2003Q1 2004Q1 2005Q1 2006Q1 200701 2008Q1 2009Q1 2010Q1 2011Q1 2012Q1 2013Q1 2014Q1 2015Q1 2016Q1 2017Q1 201801 Tourism activity employment (in thousands) 400 , 800
Step by Step Solution
3.30 Rating (159 Votes )
There are 3 Steps involved in it

Get step-by-step solutions from verified subject matter experts