

Use the data set EPS_Domestic_Violence to reproduce the chart from Problem 3.14. Data from Problem 3.14 The
Question:
Use the data set “EPS_Domestic_Violence” to reproduce the chart from Problem 3.14.
Data from Problem 3.14
The chart below presents quarterly criminal domestic violence data from Edmonton, Canada. Q1 stands for the first quarter of every year.
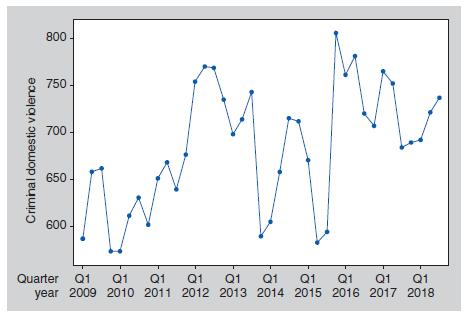
a) Approximately how many cases of criminal domestic violence were reported for the first quarter of 2013?
b) Is a seasonal behavior evident?
Fantastic news! We've Found the answer you've been seeking!
Step by Step Answer:

Answered By
Aysha Ali
my name is ayesha ali. i have done my matriculation in science topics with a+ . then i got admission in the field of computer science and technology in punjab college, lahore. i have passed my final examination of college with a+ also. after that, i got admission in the biggest university of pakistan which is university of the punjab. i am studying business and information technology in my university. i always stand first in my class. i am very brilliant client. my experts always appreciate my work. my projects are very popular in my university because i always complete my work with extreme devotion. i have a great knowledge about all major science topics. science topics always remain my favorite topics. i am also a home expert. i teach many clients at my home ranging from pre-school level to university level. my clients always show excellent result. i am expert in writing essays, reports, speeches, researches and all type of projects. i also have a vast knowledge about business, marketing, cost accounting and finance. i am also expert in making presentations on powerpoint and microsoft word. if you need any sort of help in any topic, please dont hesitate to consult with me. i will provide you the best work at a very reasonable price. i am quality oriented and i have 5 year experience in the following field.
matriculation in science topics; inter in computer science; bachelors in business and information technology
_embed src=http://www.clocklink.com/clocks/0018-orange.swf?timezone=usa_albany& width=200 height=200 wmode=transparent type=application/x-shockwave-flash_
11+ Reviews
14+ Question Solved
Related Book For 

Principles Of Managerial Statistics And Data Science
ISBN: 9781119486411
1st Edition
Authors: Roberto Rivera
Question Posted:
