

With the data set Census_Data_Selected_socioeconomic_indicators_in_Chicago_2008_2012, use statistical software to show that the coefficients, their standard errors, and
Question:
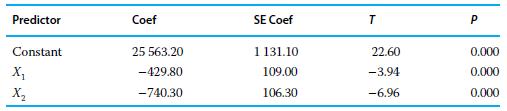
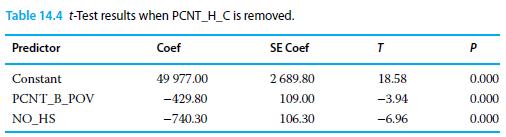
With the data set “Census_Data_Selected_socioeconomic_indicators_in_Chicago_2008_2012,” use statistical software to show that the coefficients, their standard errors, and t-tests are the ones presented in the table from Problem 14.28. Note that the last row in the data set is for all of Chicago and thus must be deleted for your analysis.
Problem 14.28
The table below is analogous to Table 14.4, but the predictors have been centered: X1 = centered PCNT_B_POV, X1 = centered NO_HS.
Fantastic news! We've Found the answer you've been seeking!
Step by Step Answer:

Answered By
PALASH JHANWAR
I am a Chartered Accountant with AIR 45 in CA - IPCC. I am a Merit Holder ( B.Com ). The following is my educational details.
PLEASE ACCESS MY RESUME FROM THE FOLLOWING LINK: https://drive.google.com/file/d/1hYR1uch-ff6MRC_cDB07K6VqY9kQ3SFL/view?usp=sharing
3+ Reviews
10+ Question Solved
Related Book For 

Principles Of Managerial Statistics And Data Science
ISBN: 9781119486411
1st Edition
Authors: Roberto Rivera
Question Posted:
