

The demand for hamburgers is shown in the following figures, with hamburgers priced in dollars in Figure
Question:
The demand for hamburgers is shown in the following figures, with hamburgers priced in dollars in Figure a and pennies in Figure b. Calculate the slope of each demand curve and use your answers to explain why slope is not a useful measure of responsiveness of the quantity demanded to price changes. How can you use the information presented in these figures to obtain a more useful measure of responsiveness of the quantity demanded to price changes?
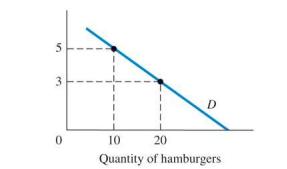
a. Prices of hamburgers (dollars)
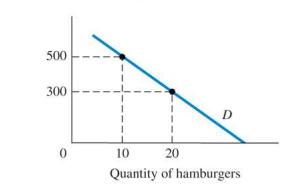
b. Prices of hamburgers (pennies).
Fantastic news! We've Found the answer you've been seeking!
Step by Step Answer:

Answered By
Joseph Mwaura
I have been teaching college students in various subjects for 9 years now. Besides, I have been tutoring online with several tutoring companies from 2010 to date. The 9 years of experience as a tutor has enabled me to develop multiple tutoring skills and see thousands of students excel in their education and in life after school which gives me much pleasure. I have assisted students in essay writing and in doing academic research and this has helped me be well versed with the various writing styles such as APA, MLA, Chicago/ Turabian, Harvard. I am always ready to handle work at any hour and in any way as students specify. In my tutoring journey, excellence has always been my guiding standard.
1+ Reviews
10+ Question Solved
Related Book For 

Mylab Economics With Pearson Access Code For Principles Of Microeconomics
ISBN: 9780135197141,9780135197103
13th Edition
Authors: Karl E. Case; Ray C. Fair; Sharon E. Oster
Question Posted:
