

Question: 4.9 Death by Intent The data described in Exercise 4.4 also indicated that the homicide rates for some counties should be treated with caution because
4.9 Death by Intent The data described in Exercise 4.4 also indicated that the homicide rates for some counties should be treated with caution because of low counts: DEATH2
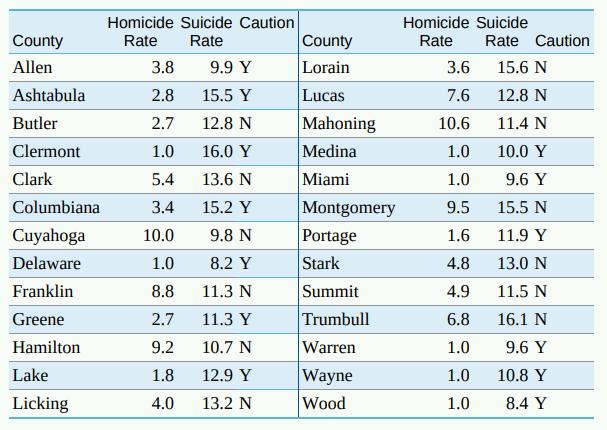
(a) Make a scatterplot of homicide rate versus suicide rate for all 26 counties. Use separate symbols to distinguish counties for which the homicide rate is to be treated with caution from those for which there is no caution.
(b) Does the same overall pattern hold for both types of counties? What is the most important difference between the two types of counties?
Homicide Suicide Caution Homicide Suicide County Rate Rate County Rate Rate Caution Allen 3.8 9.9 Y Lorain 3.6 15.6 N Ashtabula 2.8 15.5 Y Lucas 7.6 12.8 N Butler 2.7 12.8 N Mahoning 10.6 11.4 N Clermont 1.0 16.0 Y Medina 1.0 10.0 Y Clark 5.4 13.6 N Miami 1.0 9.6 Y Columbiana 3.4 15.2 Y Montgomery 9.5 15.5 N Cuyahoga 10.0 9.8 N Portage 1.6 11.9 Y Delaware 1.0 8.2 Y Stark 4.8 13.0 N Franklin 8.8 11.3 N Summit 4.9 11.5 N Greene 2.7 11.3 Y Trumbull 6.8 16.1 N Hamilton 9.2 10.7 N Warren 1.0 9.6 Y Lake 1.8 12.9 Y Wayne 1.0 10.8 Y Licking 4.0 13.2 N Wood 1.0 8.4 Y
Step by Step Solution
There are 3 Steps involved in it

Get step-by-step solutions from verified subject matter experts