

Question: Data generated by software. The following 20 observations on y and x were generated by a computer program. (a) Make a scatterplot and describe the
Data generated by software. The following 20 observations on y and x were generated by a computer program.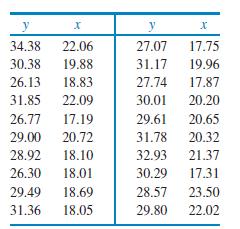
(a) Make a scatterplot and describe the relationship between y and x.
(b) Find the equation of the least-squares regression line and add the line to your plot
(c) Plot the residuals versus x.
(d) What percent of the variability in y is explained by x?
(e) Summarize your analysis of these data in a short paragraph.
y x y x 34.38 22.06 27.07 17.75 30.38 19.88 31.17 19.96 26.13 18.83 27.74 17.87 31.85 22.09 30.01 20.20 26.77 17.19 29.61 20.65 29.00 20.72 31.78 20.32 28.92 18.10 32.93 21.37 26.30 18.01 30.29 17.31 29.49 18.69 28.57 23.50 31.36 18.05 29.80 22.02
Step by Step Solution
There are 3 Steps involved in it

Get step-by-step solutions from verified subject matter experts