

Question: Evaluate the figure below based on how the data in each group overlaps. The figure shows the individual scores in each of two groups. Based
Evaluate the figure below based on how the data in each group overlaps. The figure shows the individual scores in each of two groups. Based on the figure, which of the following statements is true?
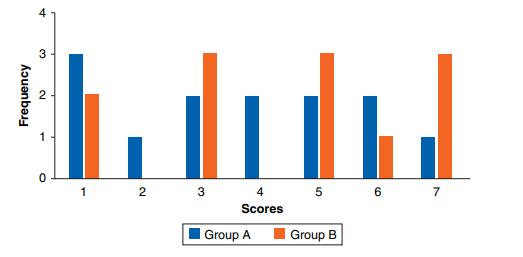
a. It is not likely that these data will lead to a decision to reject the null hypothesis.
b. It is likely that these data will lead to a decision to reject the null hypothesis.
+ 3 1 0 1 2 3 4 5 6 7 Scores Group A Group B
Step by Step Solution
There are 3 Steps involved in it
1 Expert Approved Answer
Step: 1 Unlock

Question Has Been Solved by an Expert!
Get step-by-step solutions from verified subject matter experts
Step: 2 Unlock
Step: 3 Unlock