

Question: For the following boxplot image, data in which group likely contains an outlier? a. Group A b. Group B c. An outlier is not evident
For the following boxplot image, data in which group likely contains an outlier?
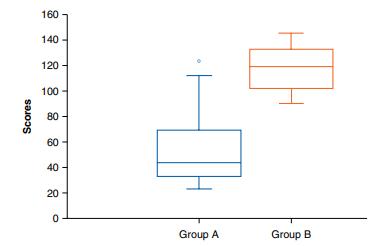
a. Group A
b. Group B
c. An outlier is not evident in either group.
Scores 160 140 120- 100- 8 80 60 40 20 0 Group A Group B
Step by Step Solution
There are 3 Steps involved in it
1 Expert Approved Answer
Step: 1 Unlock

Question Has Been Solved by an Expert!
Get step-by-step solutions from verified subject matter experts
Step: 2 Unlock
Step: 3 Unlock