

Question: Stretching a scatterplot. Changing the units of measurement can greatly alter the appearance of a scatterplot. Consider the following data: Make a scatterplot suitable for
Stretching a scatterplot. Changing the units of measurement can greatly alter the appearance of a scatterplot. Consider the following data: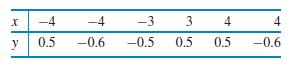
Make a scatterplot suitable for predicting fund returns fromEAFE returns. Is there a clear straight-line pattern? How strong is this pattern? (Give a numerical measure.) Are there any extreme outliers?
x -4 -4 -3 3 4 4 y 0.5 -0.6 -0.5 0.5 0.5 -0.6
Step by Step Solution
There are 3 Steps involved in it
1 Expert Approved Answer
Step: 1 Unlock

Question Has Been Solved by an Expert!
Get step-by-step solutions from verified subject matter experts
Step: 2 Unlock
Step: 3 Unlock