

Question: Th e SPSS output for the tests for normality are shown in the following image for these data at a .05 level of signifi cance.
Th e SPSS output for the tests for normality are shown in the following image for these data at a .05 level of signifi cance. Which of the following statements is true regarding these tests?
a. Th e data for both levels of therapy violate assumptions for normality.
b. Th e data for both levels of depression violate the assumption of normality.
c. Th e tests for normality show that the normality assumption is violated.
d. All tests for normality show that the normality assumption is satisfi ed.
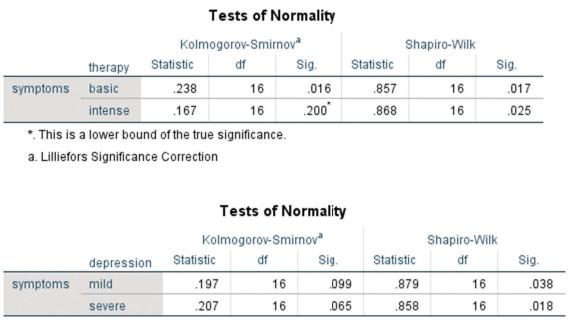
Tests of Normality Kolmogorov-Smirnov Shapiro-Wilk therapy Statistic df Sig. Statistic df Sig. symptoms basic 238 16 .016 .857 16 .017 intense .167 16 200 .868 16 .025 *This is a lower bound of the true significance. a. Lilliefors Significance Correction Tests of Normality Kolmogorov-Smirnov Shapiro-Wilk depression Statistic df Sig. Statistic df Sig. symptoms mild .197 16 .099 .879 16 .038 severe .207 16 .065 .858 16 .018
Step by Step Solution
There are 3 Steps involved in it

Get step-by-step solutions from verified subject matter experts