

Question: The image below shows the SPSS output table for the Mann-Whitney U test for the following 10 scores on a standardized assessment delivered either in
The image below shows the SPSS output table for the Mann-Whitney U test for the following 10 scores on a standardized assessment delivered either in print (scores: 5, 4, 6, 5, 5, 3, 4, 4, 7, 8) or electronically (scores: 7, 6, 7, 8, 5, 7, 6, 4, 5, 6). [Please feel free to enter these data in SPSS and follow the directions given in Section 18.7 to reproduce the SPSS output table shown.] Based on the data summarized in the table, which of the following statements are true?
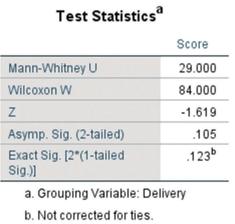
a. The value of the test statistic, U, is 29.00.
b. The value of the normal approximation for the Mann-Whitney U test is −1.619
c. The decision for this test is to fail to reject the null hypothesis, p = .105, two-tailed.
d. All of the above is true.
Test Statistics Score Mann-Whitney U 29.000 Wilcoxon W 84.000 N -1.619 Asymp. Sig. (2-tailed) .105 Exact Sig. [2*(1-tailed .123b Sig.)] a. Grouping Variable: Delivery b. Not corrected for ties.
Step by Step Solution
There are 3 Steps involved in it

Get step-by-step solutions from verified subject matter experts