

Question: The image below used a bar chart to summarize the results of an assessment taken at four times. What feature in the figure summarizes the
The image below used a bar chart to summarize the results of an assessment taken at four times. What feature in the figure summarizes the standard error or the mean for these data?
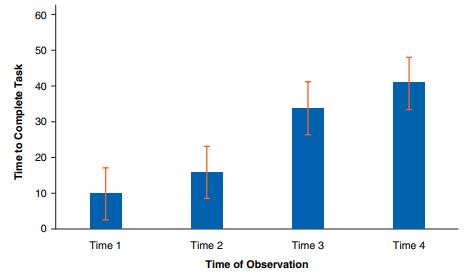
a. The height of the rectangular bars in the figure.
b. The distance between the rectangular bars in the figure.
c. The vertical lines extending above and below each mean plot.
60 Time to Complete Task 50 40 T 30 20 T 10 0 Time 1 Time 2 Time 3 Time 4 Time of Observation
Step by Step Solution
There are 3 Steps involved in it
1 Expert Approved Answer
Step: 1 Unlock

Question Has Been Solved by an Expert!
Get step-by-step solutions from verified subject matter experts
Step: 2 Unlock
Step: 3 Unlock