

Question: Analytics manager Vicky Luo has been asked to analyze total purchases grouped by quality level and subtotaled by supplier category (P or S). APPROACH c
Analytics manager Vicky Luo has been asked to analyze total purchases grouped by quality level and subtotaled by supplier category (‘P’ or ‘S’).
APPROACH c Excel’s PivotTable tool is applied to the set of supplier records in Figure G.5.
The Quality field is placed in the Rows area, the SupCat field is placed in the Columns area, and the Purchases field is placed in the Values area (automatically summed by default). Figure G.6 shows the PivotTable\
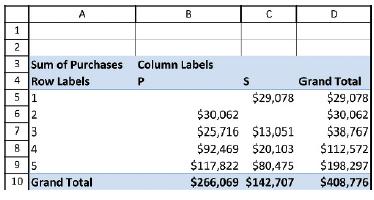
1 2 A B D 3 Sum of Purchases 4 Row Labels P Column Labels S Grand Total 5 1 62 $29,078 $29,078 $30,062 $30,062 7 3 8 4 $25,716 $13,051 $38,767 $92,469 $20,103 $112,572 95 $117,822 $80,475 $198,297 10 Grand Total $266,069 $142,707 $408,776
Step by Step Solution
There are 3 Steps involved in it

Get step-by-step solutions from verified subject matter experts