

Question: The following digraph represents the changes in weather from one day to the next in Erie, Pennsylvania. Determine the associated transition matrix and the probability
The following digraph represents the changes in weather from one day to the next in Erie, Pennsylvania.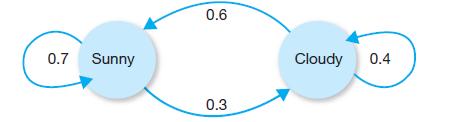
Determine the associated transition matrix and the probability that it will be cloudy in 3 days given that it is cloudy today.
0.7 Sunny 0.6 0.3 Cloudy 0.4
Step by Step Solution
★★★★★
3.31 Rating (142 Votes )
There are 3 Steps involved in it
1 Expert Approved Answer
Step: 1 Unlock

Question Has Been Solved by an Expert!
Get step-by-step solutions from verified subject matter experts
Step: 2 Unlock
Step: 3 Unlock