

Explain why each voltammogram from the rotating disk electrode in Figure 17-16 reaches a plateau at low
Question:
Explain why each voltammogram from the rotating disk electrode in Figure 17-16 reaches a plateau at low potential and at high potential. What chemistry occurs in each plateau? Why do all the curves overlap at low potential? How might the current density in each plateau change if the rotation speed were decreased?
In Figure 17-16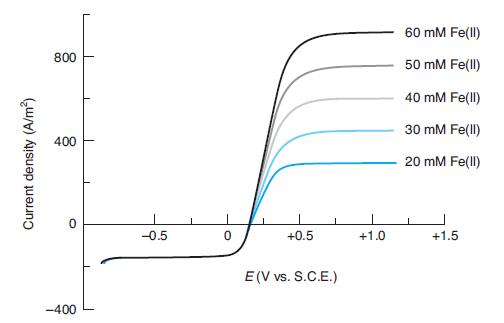
Fantastic news! We've Found the answer you've been seeking!
Step by Step Answer:
Each volt amm ogram reaches a plateau at low potential beca...View the full answer

Answered By
Jemima Wangu
I am a proficient tutor with the following skills;
Effective time management
Microsoft Office
Computer skills
Multitasking skills
Strong Mathematical skills
Honesty and integrity
Advanced technology skills
Motivated attitude
Content writing
Content research and development
0 Reviews
10+ Question Solved
Related Book For 

Question Posted:
