

Question: a. Figure 22-27 is a high-resolution mass spectrum with a parent ion C8H11N4O2+ C 8 H 11 N 4 O + 2 at m/z 195.087
a. Figure 22-27 is a high-resolution mass spectrum with a parent ion C8H11N4O2+ C8H11N4O+2 at m/z 195.087 55. m/z 195.087 55. Isotopic masses in Table 22-1 give m/z=195.087 63m/z = 195.087 63 for this formula. The difference of 0.000 08 0.000 08 is due mainly to using isotopic masses published at different times and partly from rounding of mass to five decimal places in Table 22-1. Write the formulas of the four isotopologues with nominal mass 197 197 in the middle spectrum of Figure 22-27.
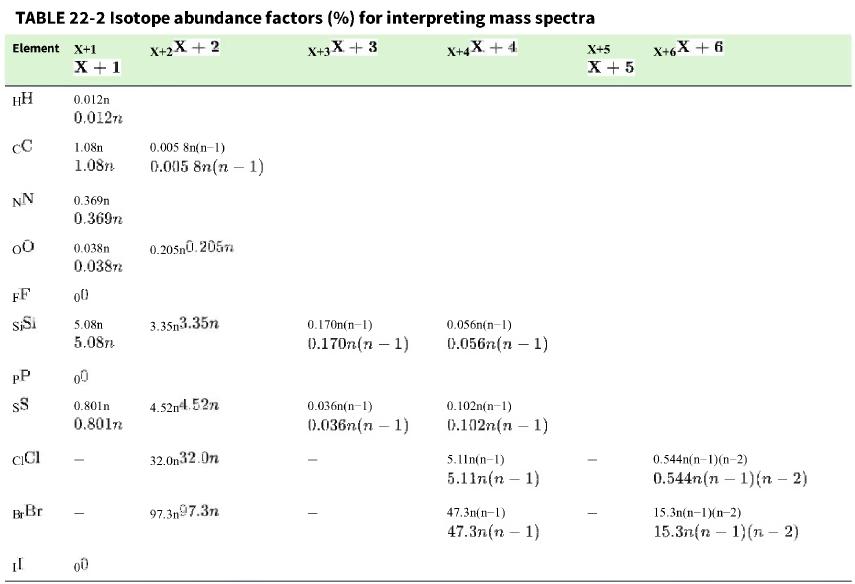
b. From Table 22-2, predict the relative sizes of the two largest peaks C128H111N144O18O16+12C81H1114N418O16O+ and C132C126H111N144O162+.13C212C61H1114N416O+2. Does the observed spectrum agree with your prediction?
Figure 22-27
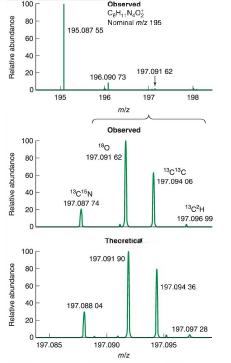
Table 22-1
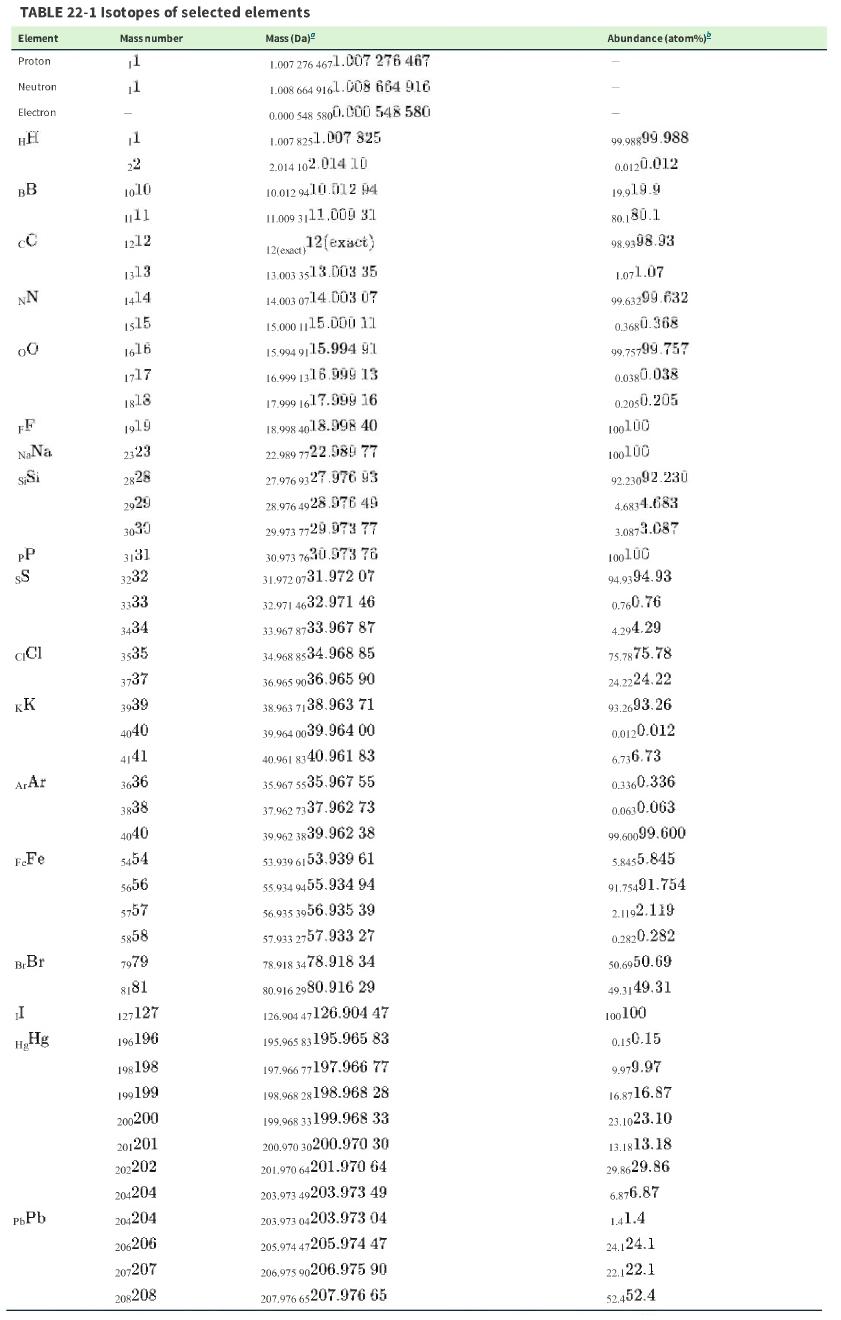
Table 22-2
Relative abundance Relative abundance Relative abundance 100 80 60 40 20 D 100 80 60 40 D 100 80 60 40 20 T 195 197.085 195.087 55 196.090 73 Chserved CH, NO Nominal m/z 195 13C16N 197.087-74 196 miz 180 197.091 62 197.088 04 Observed 197.091 90 Theoretica 197.091 62 N 197.090 miz 197 198 CC 197.094 06 1302H 197.096 99 197.094 36 197.096 197.097 28
Step by Step Solution
3.36 Rating (162 Votes )
There are 3 Steps involved in it
a To find the isotopologues with nominal mass 197 in the middle sp... View full answer

Get step-by-step solutions from verified subject matter experts