

Question: Select indicators from Table 10-3 that would be useful for the titrations in Figures 10-1 and 10-2 and the pK a = 8 curve in
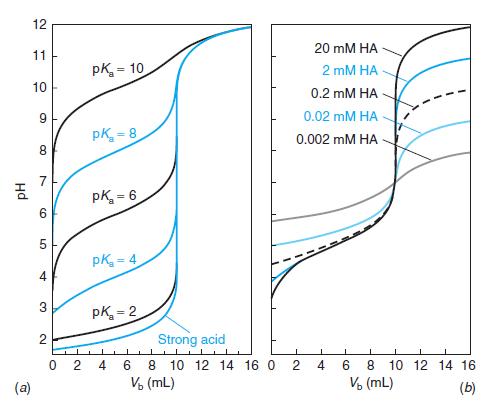
Select indicators from Table 10-3 that would be useful for the titrations in Figures 10-1 and 10-2 and the pKa = 8 curve in Figure 10-3. Select a different indicator for each titration and state what color change you would use as the end point.
Table 10-1
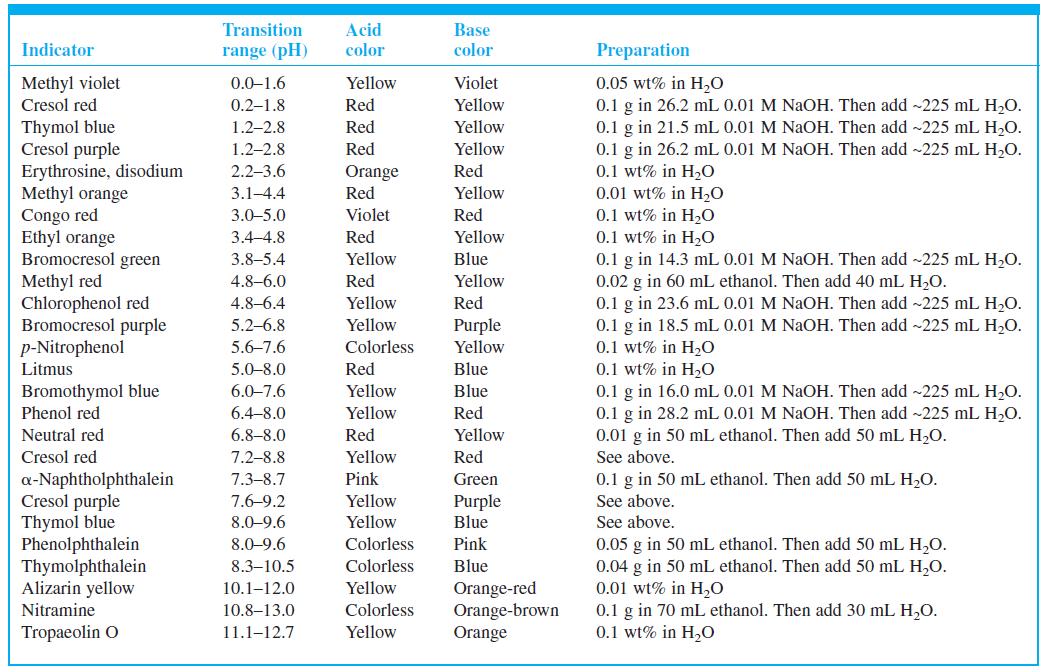
Figure 10-1
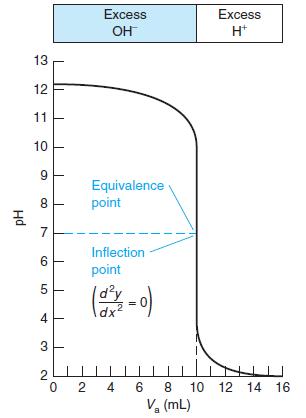
Figure 10-2
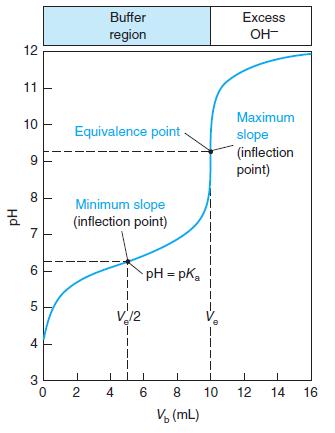
Figure 10-3
Base color Transition Acid color Indicator range (pH) Preparation Methyl violet Cresol red Violet 0.05 wt% in H,O 0.1 g in 26.2 mL 0.01 M NaOH. Then add -225 mL H2O. 0.1 g in 21.5 mL 0.01 M NaOH. Then add ~225 mL H,O. 0.1 g in 26.2 mL 0.01 M NaOH. Then add ~225 mL H,O. 0.1 wt% in H20 0.01 wt% in H,O 0.1 wt% in H20 0.1 wt% in H,O 0.1 g in 14.3 mL 0.01 M NaOH. Then add ~225 mL H2O. 0.02 g in 60 mL ethanol. Then add 40 mL H,O. 0.1 g in 23.6 mL 0.01 M NaOH. Then add ~225 mL H2O. 0.1 g in 18.5 mL 0.01 M NaOH. Then add ~225 mL H,O. 0.1 wt% in H20 0.1 wt% in H20 0.1 g in 16.0 mL 0.01 M NaOH. Then add ~225 mL H,O. 0.1 g in 28.2 mL 0.01 M NaOH. Then add ~225 mL H2O. 0.01 g in 50 mL ethanol. Then add 50 mL H2O. See above. 0.0-1.6 Yellow 0.2-1.8 Red Yellow Thymol blue Cresol purple Erythrosine, disodium Methyl orange Congo red Ethyl orange Bromocresol green Methyl red Chlorophenol red Bromocresol purple p-Nitrophenol 1.2-2.8 Red Yellow 1.2-2.8 Red Yellow 2.2-3.6 Orange Red 3.1-4.4 Red Yellow 3.0-5.0 Violet Red 3.4-4.8 Red Yellow 3.85.4 Yellow Blue 4.8-6.0 Red Yellow 4.86.4 Yellow Red 5.2-6.8 Yellow Purple Yellow 5.67.6 Colorless Litmus 5.0-8.0 Red Blue Bromothymol blue Phenol red Neutral red Cresol red 6.0-7.6 Yellow Blue 6.4-8.0 Yellow Red 6.88.0 Red Yellow 7.2-8.8 Yellow Red 0.1 g in 50 mL ethanol. Then add 50 mL H2O. a-Naphtholphthalein Cresol purple Thymol blue Phenolphthalein Thymolphthalein Alizarin yellow 7.38.7 Pink Green 7.6-9.2 Yellow Purple Blue See above. 8.0-9.6 Yellow See above. 8.0-9.6 Colorless Pink 0.05 g in 50 mL ethanol. Then add 50 mL H,O. 0.04 g in 50 mL ethanol. Then add 50 mL H,O. 0.01 wt% in H,O 0.1 g in 70 mL ethanol. Then add 30 mL H,O. 0.1 wt% in H,0 8.310.5 Colorless Blue Yellow Colorless Orange-red Orange-brown Orange 10.112.0 Nitramine 10.813.0 Tropaeolin O 11.112.7 Yellow
Step by Step Solution
3.39 Rating (161 Votes )
There are 3 Steps involved in it
Therefore the indicators selected would be Figure 101 Brom... View full answer

Get step-by-step solutions from verified subject matter experts