

Two peaks emerge from a chromatography column as sketched in the following illustration. where N is the
Question:
Two peaks emerge from a chromatography column as sketched in the following illustration.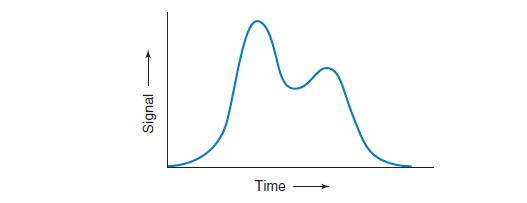
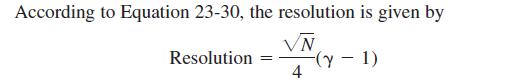
where N is the number of theoretical plates and γ is the separation factor, defined as the quotient of linear velocities of the two solutes (γ > 1).
(a) If you change the solvent or the stationary phase, you will change the separation factor. Sketch the chromatogram if γ increases but N is constant.
(b) If you increase the column length or decrease the particle size or flow rate, you can increase the number of plates. Sketch the chromatogram if N increases but γ is constant.
Step by Step Answer:

This question has not been answered yet.
You can Ask your question!
Related Book For 
Question Posted:
