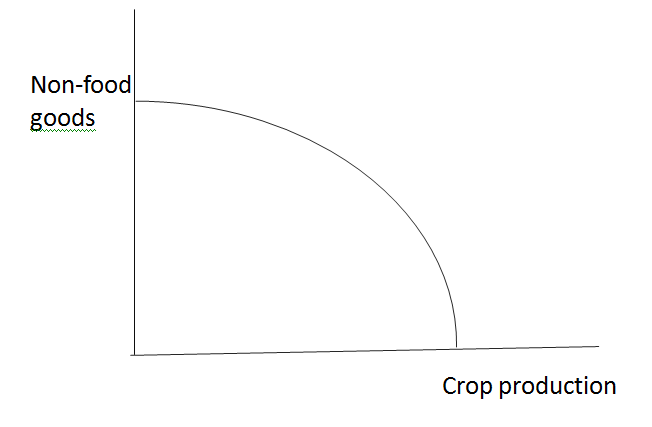
1. Below is a graph production possibility curve. Show on the graph the impact of a new...
Question:
1. Below is a graph production possibility curve. Show on the graph the impact of a new technology which increases the crop yield on the same amount of land? Explain.
2. Determine whether the following statement is true or false. Then explain why the answer is true or false.
?If two countries trade with one another, they can both benefit from the trade as long as each country specializes in producing the good that it is relatively more efficient at producing.?
3. In a recent student selected article, ?Why Women Are No Longer Catching Up To Men On Pay,? there a1re various reasons given for why men are making more money than women. An important change in the education level of men and women is that there are now four women in college for every three men in college. Will this make the pay gap between men and women in the future larger or smaller? When making this forecast review the article carefully as to the reasons why the pay gap continues to persist.
4. The following is a circular flow diagram showing the relationship between firms, households, government and the financial markets. It is possible to derive equations from these flows since the money flow into a box must equal the flow out. In the diagram below the line between the financial market box and the government box is labeled ?Deficit (GD)?

While the government usually operates with a deficit, there have been a few years where the government has operated with a surplus. For example, this happened in the late 1990s.
(a) If the government operates with a surplus, this will change the diagram. What will the new diagram look like?
(b) If the diagram is different, then the equations derived from the diagram will be somewhat different. What will the new government balance equation and the new financial market balance equation is?
Expert Answer:
1 Figure 1 shows production possibility curve It indicates the tradeoff in output between crop production and nongood food The crop production and non... View the full answer