

1. Consider a simple market with just five potential renters and four apartments. This table shows the...
Question:
1.
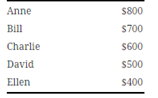
Consider a simple market with just five potential renters and four apartments. This table shows the maximum amount that each renter would be willing to pay for an apartment.
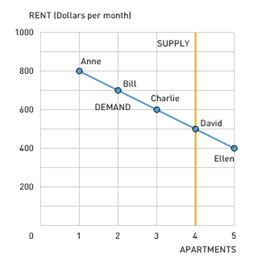
The following graph sows the supply and demands curves in this market. The supply curve is represented as a vertical line at 4. (to keep the problem simple, we will assume that it is impossible to build new apartments. so the supply remains fixe at four.) On the demand curve, each point is labeled with the name of the corresponding renter. This demand curve shows that, for example, at a price of $700, only two renters, Anne and Bill, would demand an apartment.
6.3. If David and Ellen live in rent-controlled apartments, what is the equilibrium price for the non-rent-controlled apartments?
(Hint: You can use the navigation links at the bottom of the page to view your answer to the previous question.)
2.
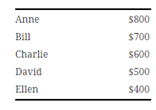
Consider a simple market with just five potential renters and four apartments. This table shows the maximum amount that each renter would be willing to pay for an apartment.
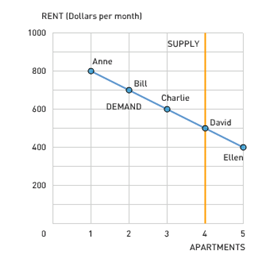
The following graph shows the supply and demand curves in this market. The supply curve is represented as a vertical line at 4. (To keep the problem simple, we will assume that it is impossible to build new apartments, so the supply remains fixed at four.) On the demand curve, each point is labeled with the name of the corresponding renter. This demand curve shows that, for example, at a price of $700, only two renters, Anne and Bill, would demand an apartment.
6.4 Again, assume David and Ellen live in rent-controlled apartments. By how much will rent on non-rent-controlled apartments decrease if price controls are removed? (Hint: Use the navigation links at the bottom of the page to view your answers to the previous questions.)
Expert Answer:


Fundamentals of corporate finance
ISBN: 978-0078034633
10th edition
Authors: Stephen Ross, Randolph Westerfield, Bradford Jordan
