

1) The following data represent the times in minutes required for 18 co-workers to commute to work....
Fantastic news! We've Found the answer you've been seeking!
Question:
1) The following data represent the times in minutes required for 18 co-workers to commute to work.
31 17 38 33 42 36
38 42 45 26 43 48
16 32 23 40 44 12
Construct the stem-and-leaf plot.
2) (5 points)
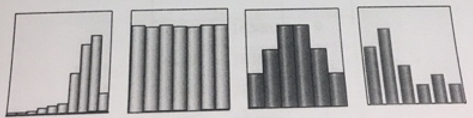
a) Pick the graph that best describes the following distribution shape: skewed to the right
b)
Classify the distribution as one of the following:
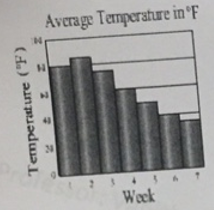
i) Time series study
ii) Cross sectional study
Expert Answer:
1 Stemandleaf plot A stem and leaf plot is a special table where each data value is split in... View the full answer

Related Book For 

Posted Date:
