

A property agent has collected selling price information on the homes sold in the last month. Below
Fantastic news! We've Found the answer you've been seeking!
Question:
A property agent has collected selling price information on the homes sold in the last month. Below are two graphs he has used to describe the data:

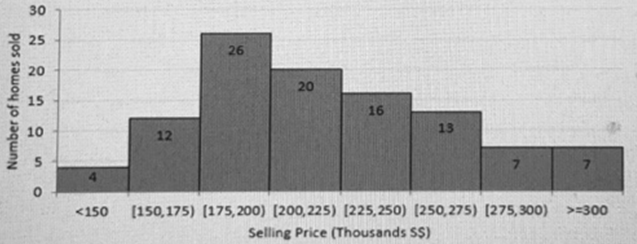
- Describe the type of statistical charts used above, and explain why the two charts look differently. Interpret the selling price information shown in the two charts.
- Identify the number of homes that were sold for less than $2001000
- Estimate the percentage of homes that were sold for more than $ 220,000.
Expert Answer:
1 The type of statistical charts used are Histograms A histogram is a type of graph that is widely u... View the full answer

Related Book For 

Statistical Techniques in Business and Economics
ISBN: 978-0078020520
16th edition
Authors: Douglas Lind, William Marchal
Posted Date:
