

Question: A store wants to predict net profit as a function of sales for next year. Historical data for 8 years is given in the table
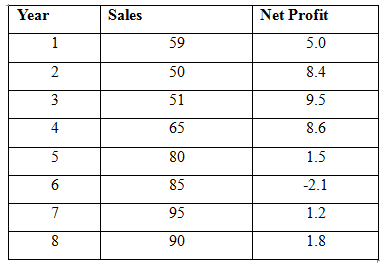
A store wants to predict net profit as a function of sales for next year. Historical data for 8 years is given in the table below.
(a) Make a scatter diagram for the data, using Sales for the independent variable and Net Profit for the dependent variable. Insert the trend line and add the equation and R2 value to the diagram.
(b) Determine the correlation coefficient. Comment on the value of the correlation coefficient.
(c) Find the predicted value of Y given X = 75. Give an interpretation of the predicted value in the context of the problem.
(d) Construct an ANOVA table and attach the summary output.
Year 1 2 3 4 5 6 7 8 Sales 59 50 51 65 80 85 95 90 Net Profit 5.0 8.4 9.5 8.6 1.5 -2.1 1.2 1.8
Step by Step Solution
3.43 Rating (162 Votes )
There are 3 Steps involved in it
To address your question lets break down each part a Scatter Diagram 1 Plot Sales vs Net Profit Sale... View full answer

Get step-by-step solutions from verified subject matter experts