

A tensile testing machine is shown in the following figure to determine the behavior of materials as
Fantastic news! We've Found the answer you've been seeking!
Question:
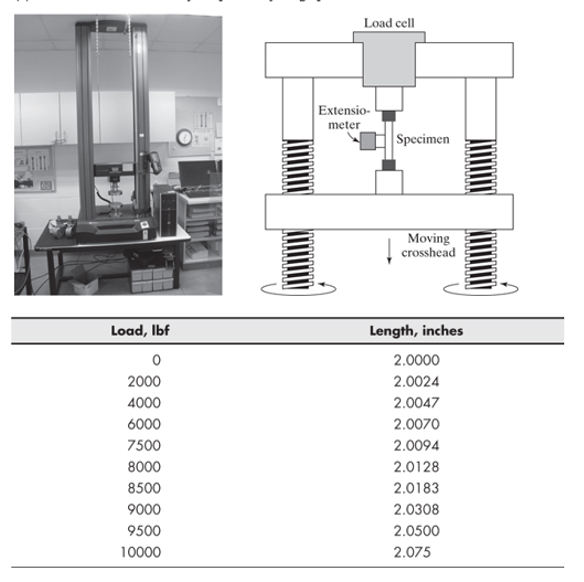
A tensile testing machine is shown in the following figure to determine the behavior of materials as they are deformed.
(a) Use the provided data to calculate the stress and the corresponding strain for each data pair. The tested sample was a rod of diameter 0.505 in., so you'll need to find the cross-sectional area to use in your calculations.
(b) Create an x-y plot with strain on the x-axis and tress on the y-axis. Connect the data points with a solid black line, and use circles to mark each data points.
(c) Add a title and appropriate axis labels.
(d) Use a text box to mark the yield point on your graph.
Expert Answer:

Related Book For 

A First Course in Differential Equations with Modeling Applications
ISBN: 978-1305965720
11th edition
Authors: Dennis G. Zill
Posted Date:
