

A time series of data for a 24 hour period is given below, from 0000 on one
Question:
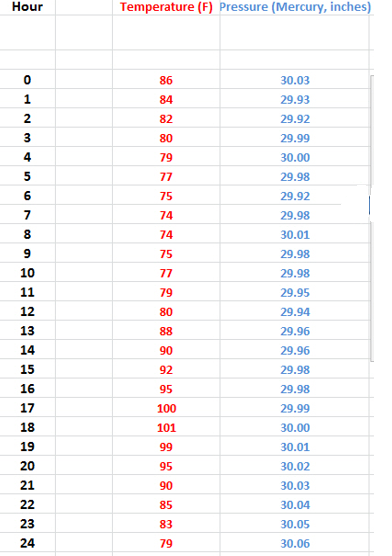
A time series of data for a 24 hour period is given below, from 0000 on one day to 2400 on that same day. The data consists of temperature (F) and pressure (inches of mercury) readings. Search the web and find a site on meteograms. Take a look at some sample meteograms and notice how they display the data. Some of them have a lot more information than just temperature and pressure-for this exercise, those two are all you have to worry about.
After you have familiarized yourself with what a meteogram is and what it looks like, display the data below in a meteogram of your own. You may construct the meteogram on graph paper, scan it, paste the result into a word document and submit it to the assignment folder or you can create meteogram in Excel, paste it in a word document and submit it to the assignment folder. Your entries will be graded according to accuracy and neatness. Try to make the presentation as professional as you can.
Expert Answer:


