

Question: Compare the utility level, a worker gets at points A, B and C on the graph below. Wage U U U Effort FIGURE 11.1 Wage,
Compare the utility level, a worker gets at points A, B and C on the graph below.
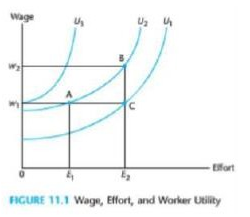
Wage U U U Effort FIGURE 11.1 Wage, Effort, and Worker Utility
Step by Step Solution
★★★★★
3.43 Rating (153 Votes )
There are 3 Steps involved in it
1 Expert Approved Answer
Step: 1 Unlock

In the graph utility curves U1 U2 U3 represent the workers utility levels These curves reflect combi... View full answer
Question Has Been Solved by an Expert!
Get step-by-step solutions from verified subject matter experts
Step: 2 Unlock
Step: 3 Unlock
Document Format (2 attachments)
609a3c7e7999a_30402.pdf
180 KBs PDF File
609a3c7e7999a_30402.docx
120 KBs Word File