

Consider the market for snow shovels. Suppose the quantity of snow shovels demanded by consumers (QD) depends
Question:
Consider the market for snow shovels. Suppose the quantity of snow shovels demanded by consumers (QD) depends on the price of a snow shovel (P) and the percentage chance of snow (C) forecasted by the local news station. Similarly, the quantity of snow shovels supplied by producers (QS) depends on the price of a snow shovel (P) and the linear-meter price of a wooden rod (W) used in the production of snow shovels.
The numerical formula for the quantity of snow shovels demanded and supplied is as follows:
Q D = 6 - P + 0.2C
Q S = 8 + P - 6W
In the following graph, use the blue points (circle symbol) to draw the market demand curve if the weather forecast says the chance of snow is 70%. (Note: Do not convert the percentage to a decimal when plugging this value into the demand curve formula.) Then use the orange points (square symbol) to draw the market supply curve if the current cost of wood is $2 per linear meter. Finally, use the black point (plus symbol) to indicate the equilibrium price and quantity in the market for snow shovels.
Suppose the price of wood increases to $3 per linear meter.
On the following graph, show the effects this has on the market for snow shovels by shifting the demand curve, the supply curve, or both.
Tool Tip: Click and drag one or both of the curves. Curves will snap into position, so if you try to move a curve and it snaps back to its original position, just try again and drag it a little farther. 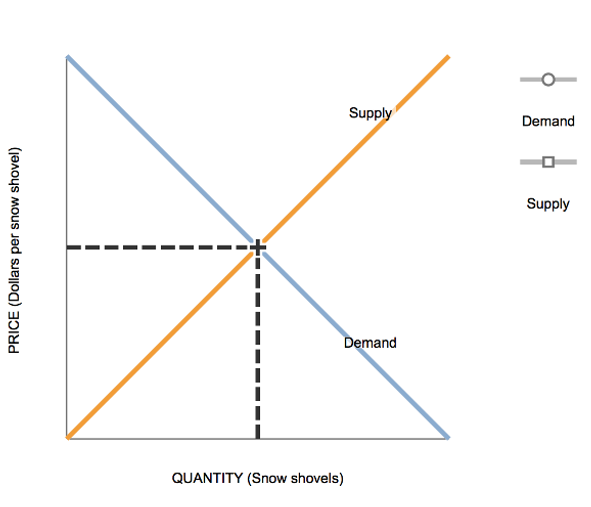
The change in the price of wood causes the equilibrium quantity to ________ and the equilibrium price to _______.
Expert Answer:


Essentials of Marketing
ISBN: 978-0078028885
13th edition
Authors: William D. Perreault, Joseph P. Cannon
