Data on a stock's closing price and its price change for the last 14 trading days appears
Question:
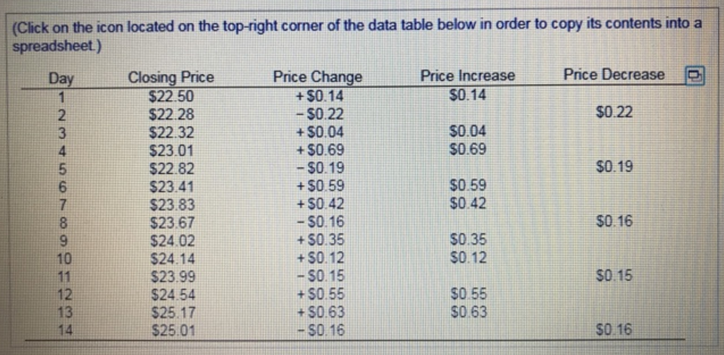
Data on a stock's closing price and its price change for the last 14 trading days appears in this table.
a. Over this 14-day period, what is the average gain on up days? (Note to calculate the average; divide the sum of all gains by 14, not the number of days on which the stock went up)
b. Over this 14-day period, what is the average loss on down days?
c. What is the RSI?
d. Is the RSI sending a strong buy or sell signal?
a. Over this 14-day period, the average price change on up days is $..... (Round to three decimal places)
b. Over this 14-day period, the average price change on down days $..... (Round to three decimal places)
c. The relative strength index (RSI) is $..... (Round to the nearest whole number)
d. Is the RSi sending a strong buy or sell signal? (Select the best choice below)
A. Values below 30 suggest that a stock is oversold, a buy signal Values above 70 suggest that a stock is overbought, a sell signal. In this case, the RSI is sending a strong sell signal.
B. Values below 30 suggest that a stock is overbought, a sell signal Values above 70 suggest that a stock is oversold, a buy signal. In this case, the RSl is sending a strong buy signal.
C. Values below 30 suggest that a stock is oversold, a sell signal. Values above 70 suggest that a stock is overbought a buy signal. In this case, the RSI is sending a strong buy signal.
D Values below 30 suggest that a stock verbought, a buy s al Values above 70 suggest at a stock s oversold a se s nal In his case the RSI s sending a strong sell signal.
Expert Answer:
The relative strength index RSI is a momentum indicator that measures the magnitude of recent ... View the full answer