

Question: From the given graph, compute the following: a. The market or equilibrium price is $????__________. b. The economic value of the 10,000th unit is $__________,
From the given graph, compute the following:
a. The market or equilibrium price is $????__________.
b. The economic value of the 10,000th unit is $__________, and the minimum price producers will accept to produce this unit is $__________.
c. When 10,000 units are produced and consumed, total consumer surplus is $__________, and total producer surplus is $__________.
d. At the market price in part a, the net gain to consumers when 10,000 units are purchased is $__________.
e. At the market price in part a, the net gain to producers when they supply 10,000 units is $__________.
f. The net gain to society when 10,000 units are produced and consumed at the market price is $__________, which is called __________.
g. In market equilibrium, total consumer surplus is $__________, and the total producer surplus is $__________.
h. The net gain to society created by this market is $__________.
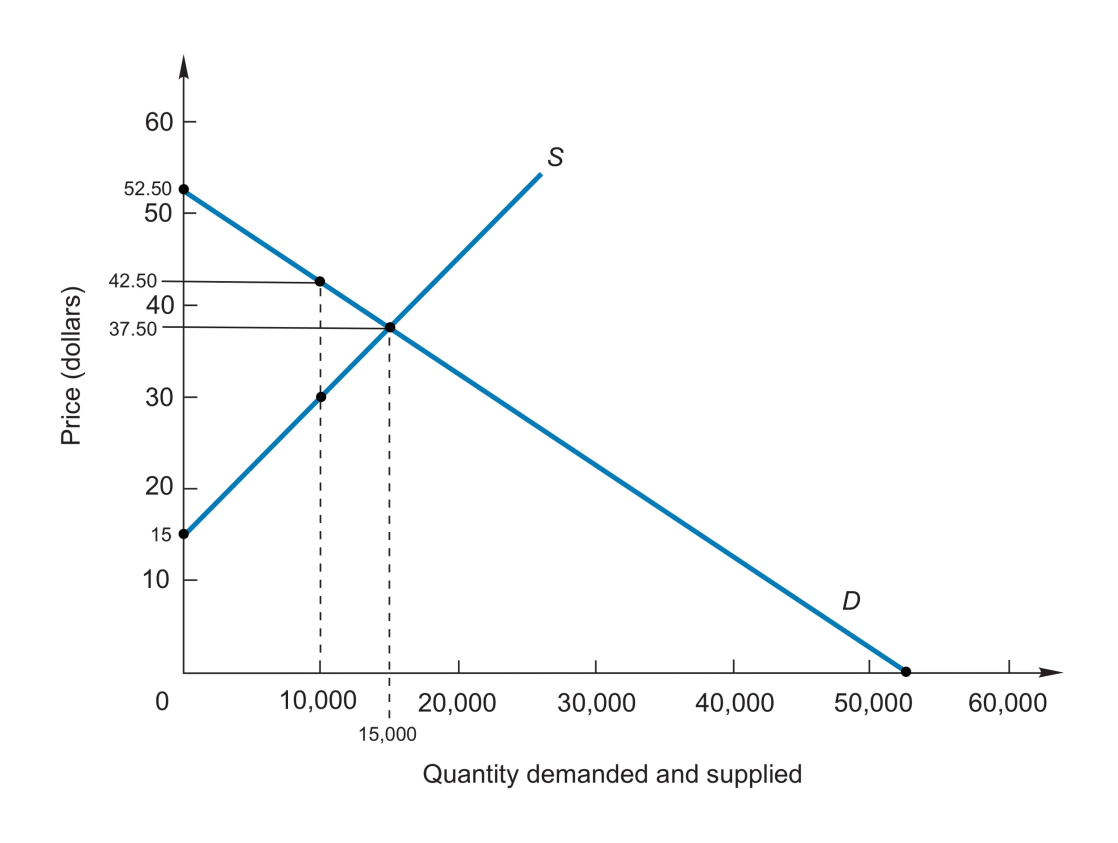
Price (dollars) 60 52.50 50 42.50 40 37.50 30 20 15 10 0 I 10,000 15,000 S 20,000 30,000 40,000 Quantity demanded and supplied D 50,000 60,000
Step by Step Solution
3.41 Rating (148 Votes )
There are 3 Steps involved in it
To answer these questions well analyze the graph provided a Market or Equilibrium Price The equilibrium price is where the demand curve D intersects t... View full answer

Get step-by-step solutions from verified subject matter experts
Document Format (2 attachments)
60918cd87120f_22432.pdf
180 KBs PDF File
60918cd87120f_22432.docx
120 KBs Word File