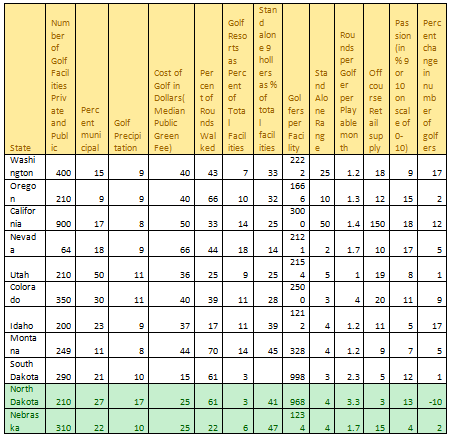
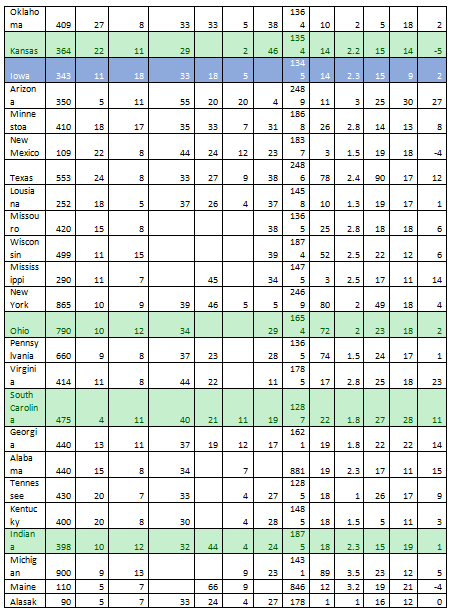
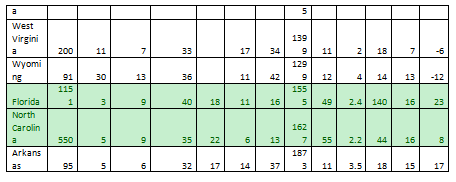
Question: How to get a good answer using data and analysis tools in jmp 1 uses the other variables to predict passion. passion would need to
How to get a good answer using data and analysis tools in jmp 1 uses the other variables to predict "passion." passion would need to be aggregated into high/low first, and then you can use logistic regression or decision trees
2 do a segmentation of the states based on all of the variables... this ends up creating groups of states by similar "golfiness". 3 the nice thing about state-level data is that you can find other variables to merge to this data. e.g. you might want to predict golfers per facility or golf participation based on variables such as population, economic development, weather, etc. this is a prediction problem so a regression or decision tree approach will be good. in cases 1 and 2, you may need to fill out the missing values (you will see i corrected this in the excel sheet),.. or there are too many missing values for a given state, just drop them. for something like iowa, you should be able to find online a number for golf facilities, or at least be able to make up a ballpark number. can ignore this point but wanted you to see if the data was clean enough to work with to answer the questions above. once you dealt with the missing values, tasks 1 and 2 should be relatively straightforward for tasks 3,
You will be using a selection of the columns from this spreadsheet plus you need to find a data set with state-level characteristics to merge together. you will discover that you need to standardize the way you spell/abbreviate states in column a in order to be able to merge the data successfully. do you know where to get this data


Califor nia Nevad a Cost of Golf in Dollars[ ate Perc Median and ent Golf Public Publ muni Precipi Green State ic cipal tation Fee) Washi ngton 400 15 Orego Utah Colora do Num ber of Idaho Monta Golf Facil ities Priv 210 900 17 64 18 210 350 200 na South Dakota North Dakota 210 Nebras ka 249 9 290 310 50 30 23 11 21 27 N 22 9 9 00 9 11 H 9 8 10 17 10 40 40 50 66 40 37 44 15 Per cen tof 25 36 25 43 66 Rou Tota tota nds I I Wal Facil facil ked ities ities 33 44 39 17 70 61 61 N N Stan Golf d Reso alon rts as Perc ent of 25 22 7 33 14 10 32 18 9 11 11 14 e9 holl 3 ers as % of 6 ch 25 14 25 N 28 39 45 Sta nd Gol Alo fers ne Ra per Facing lity 47 222 N 166 6 300 10 ON 1 215 4 250 0 121 N 25 50 N in 5 10 1.3 12 3 3 41 968 4 123 4 328 4 998 3 Rou nds per Golf er per Play able ail st 4 mon sup th ply 1.2 4 1.2 11 1.7 10 4 1 19 off or cou 10 rse on Ret scal e of 1.2 N 18 1.4 150 18 2.3 3.3 1.7 20 C 5 in Pas sion (in %69 3 10) 9 15 17 00 8 11 5 in 7 12 13 15 4 Perc ent cha nge in nu mb er of golf ers 17 2 12 in 5 1 9 17 in 5 1 -10 N Oklaho ma Kansas lowa Arizon a Minne stoa New Mexico Texas Lousia na Missou ro Wiscon sin Mississ ippi New York Ohio Pennsy Ivania Virgini a South Carolin a Georgi a Alaba ma Tennes see Kentuc ky Indian a Michig an Maine Alasak 409 364 22 343 350 410 109 553 252 420 499 290 865 790 660 414 475 440 430 400 27 398 900 110 90 11 5 in 18 22 24 18 15 11 11 10 10 D 9 440 15 11 4 13 20 20 10 9 ainin 5 00 8 11 18 11 17 8 8 5 in 00 8 15 7 9 N 12 00 8 11 11 00 8 7 00 8 12 13 7 7 33 29 33 18 55 35 37 44 24 33 27 34 33 39 46 37 34 33 37 23 33 44 22 30 20 20 40 21 32 26 33 45 19 44 5 66 24 N 5 7 12 10 4 5 11 12 7 5 4 4 38 9 9 4 46 4 7 31 23 38 37 38 39 34 in 5 29 28 4 27 11 19 17 28 24 23 27 136 4 135 4 134 5 248 9 186 8 183 7 248 6 145 8 136 5 187 4 147 in 5 246 9 165 136 in in 5 178 128 7 162 in 148 gu 187 10 14 143 14 11 $12 26 3 78 1 19 80 881 19 128 72 17 22 N 10 1.3 19 3 2.5 2.2 15 14 2.3 18 2.8 1 89 3 25 25 2.8 18 18 74 1.5 846 12 178 1 52 2.5 22 12 5 18 2.4 90 1.5 19 18 15 2 14 2.8 2 49 18 1.5 23 mim 1.8 27 30 13 5 18 2.3 15 17 17 24 17 in 5 3.5 23 18 1 26 17 3.2 19 1 16 17 11 14 18 28 N -5 11 2 19 27 25 18 23 12 21 12 00 A 1.8 22 22 14 12 2.3 17 11 15 1 6 6 4 2 1 11 9 3 1 5 -4 0 a West Virgini a Wyomi Florida North Carolin a Arkans as 200 91 115 1 550 95 11 30 3 5 in in 5 7 13 9 9 ch 6 33 36 40 35 32 18 N 22 17 17 34 11 42 11 6 ch 14 13 5 37 139 co 129 C 16 5 155 in 162 11 187 12 49 7 55 3 11 N 18 4 14 2.4 140 2.2 44 7 13 -12 16 16 -6 3.5 18 15 23 00 8 17
Step by Step Solution
There are 3 Steps involved in it
To tackle these tasks using JMP and relevant statelevel data you can follow these steps Task 1 Predicting Passion Step 1 Data Preparation Aggregate Pa... View full answer

Get step-by-step solutions from verified subject matter experts
Document Format (2 attachments)
60983d6d6b5a5_28649.pdf
180 KBs PDF File
60983d6d6b5a5_28649.docx
120 KBs Word File


