

Question: Perform an ABC (80-20 Curve) Analysts using the following data for 20 products of a company using Microsoft EXCEL. Specifically, a) What percentage of the
Perform an ABC (80-20 Curve) Analysts using the following data for 20 products of a company using Microsoft EXCEL. Specifically,
a) What percentage of the total sales is contributed by the top 20 percent of the items? By the bottom 50 percent of the items? Indicate which items are A, B or C type items. 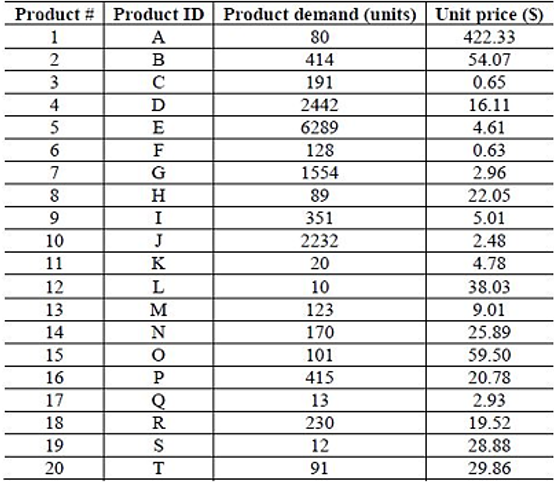
Product 1 2 3 4 5 6 7 8 9 10 11 12 13 14 15 16 17 18 19 20 Product ID Product demand (units) Unit price (S) A 80 422.33 414 54.07 191 0.65 2442 16.11 6289 4.61 128 0.63 1554 2.96 89 351 2232 20 BCDEFGH I J K L M ZOPORST N Q 10 123 170 101 415 13 230 12 91 22.05 5.01 2.48 4.78 38.03 9.01 25.89 59.50 20.78 2.93 19.52 28.88 29.86
Step by Step Solution
3.51 Rating (154 Votes )
There are 3 Steps involved in it
To perform an ABC analysis using Microsoft Excel follow these steps Step 1 Calculate Sales Value for ... View full answer

Get step-by-step solutions from verified subject matter experts