

Pictured below (in scrambled order) are three histograms. One of them represents a population distribution. The other
Fantastic news! We've Found the answer you've been seeking!
Question:
Pictured below (in scrambled order) are three histograms. One of them represents a population distribution. The other two are sampling distributions of x-bar: one for sample size n = 5 and one for sample size n = 40.
Pictured below (in scrambled order) are three histograms. One of them represents a population distribution. The other two are sampling distributions of x-bar: one for sample size n = 5 and one for sample size n = 40.
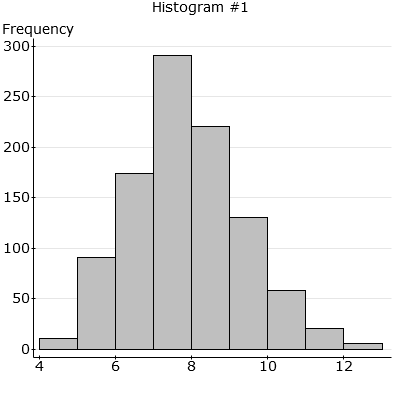
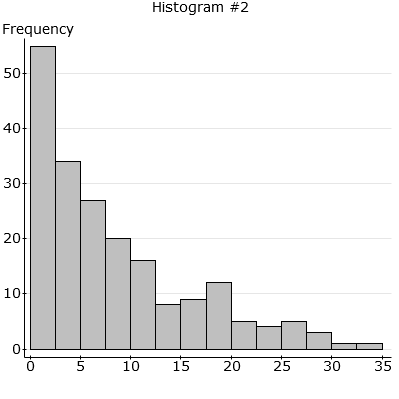
Based on the histograms, what is the most likely value of the population mean?
A 8
B 1
C 5
D 290
Expert Answer:

Related Book For 

Elementary Statistics Picturing the World
ISBN: 978-0321911216
6th edition
Authors: Ron Larson, Betsy Farber
Posted Date:
