Starr, CPA, is performing the financial statement audit of Brenda. Inc. In performing this audit, Starr has
Question:
Starr, CPA, is performing the financial statement audit of Brenda. Inc. In performing this audit, Starr has determined that she needs to perform tests of controls on the procedures used by Brenda to approve purchases made on account. Specifically, Brenda's internal control includes the following control procedures.
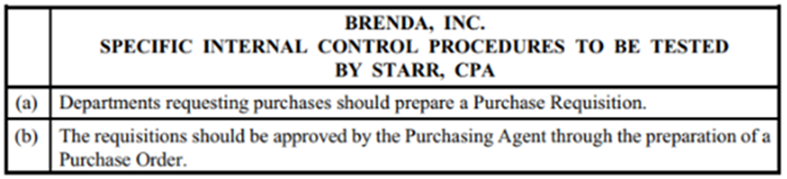
Once items purchased by Brenda are received. they are recorded in the Voucher Register. Starr feels that any cases where either of the controls arc not functioning raise serious concerns about Brenda's internal controls.
REQUIRED:
(1) What would Starr consider to be a deviation condition in this situation?
(2) How should Starr define the population? For each item selected from the population, which procedure(s) should Starr perform?
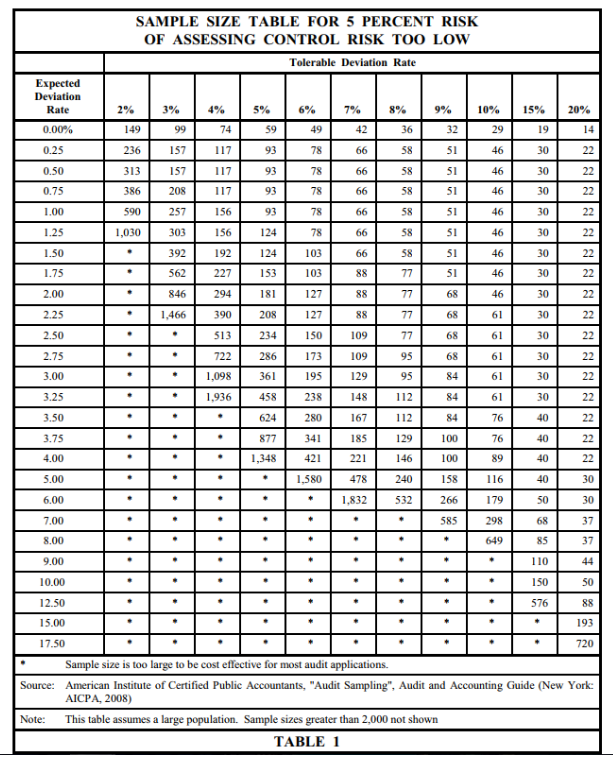
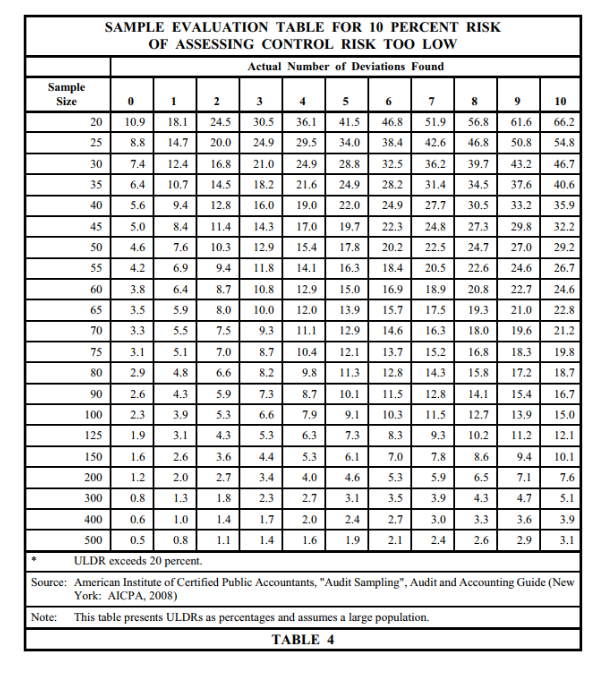
(3) Assume that Starr decided upon a risk of overreliance of 5% and a tolerable deviation rate of 4%. In addition, based on her previous experience. Starr expected a deviation rate in the population of 1.25%. What sample size should be selected by Starr?
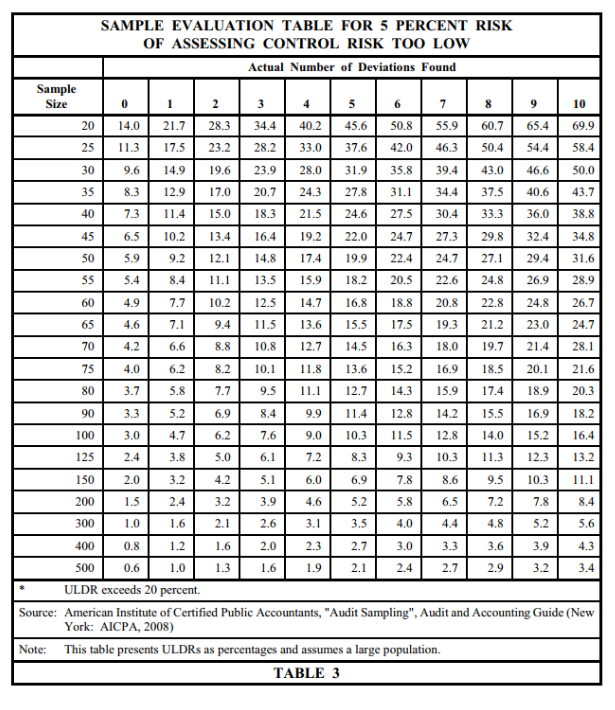
(4) Ignoring your answer to Question 3 above, assume that Starr examined 200 items and found 8 deviations.
(a) What is the sample deviation rate?
(b) What is the upper precision limit?
(c) What does the upper precision limit tell Starr?
BRENDA, INC. SPECIFIC INTERNAL CONTROL PROCEDURES TO BE TESTED BY STARR, CPA (a) Departments requesting purchases should prepare a Purchase Requisition. (b) The requisitions should be approved by the Purchasing Agent through the preparation of a Purchase Order. Expected Deviation Rate 0.00% 0.25 0.50 0.75 1.00 1.25 1.50 1.75 2.00 2.25 2.50 2.75 3.00 3.25 3.50 3.75 4.00 5.00 6.00 7.00 8.00 9.00 10.00 12.50 15.00 17.50 SAMPLE SIZE TABLE FOR 5 PERCENT RISK OF ASSESSING CONTROL RISK TOO LOW Tolerable Deviation Rate 149 236 313 386 590 1,030 3% 99 157 157 208 257 303 392 562 846 1,466 4% 5% 74 59 117 93 117 93 117 93 156 93 156 124 192 124 227 153 294 181 390 208 513 234 722 286 1,098 361 1,936 458 624 877 1,348 49 78 78 78 78 78 103 103 127 127 150 173 195 238 280 341 421 1,580 7% 42 66 66 66 66 66 66 88 88 88 109 109 129 148 167 185 221 478 1,832 . 8% 36 58 58 58 58 58 58 77 77 77 77 95 95 112 112 129 146 240 532 . . 9% 32 51 51 51 51 51 51 51 68 68 68 68 84 84 84 100 100 158 266 585 * 10% 29 46 46 46 46 46 994556TORRE 61 61 61 61 61 76 76 89 116 179 298 649 15% 20% 19 30 30 30 30 30 30 30 30 30 30 30 30 30 40 40 40 40 50 68 85 110 150 576 NNNNNNNNNNNNNNNNAARRER 22 22 22 22 22 22 22 22 22 30 30 37 37 44 50 88 193 720 Sample size is too large to be cost effective for most audit applications. Source: American Institute of Certified Public Accountants, "Audit Sampling", Audit and Accounting Guide (New York: AICPA, 2008) Note: This table assumes a large population. Sample sizes greater than 2,000 not shown TABLE 1 Expected Deviation Rate 0.00% 0.25 0.50 0.75 1.00 1.25 1.50 1.75 2.00 2.25 2.50 2.75 3.00 3.25 3.50 3.75 4.00 5.00 6.00 7.00 8.00 9.00 10.00 12.50 15.00 17.50 SAMPLE SIZE TABLE FOR 10 PERCENT RISK OF ASSESSING CONTROL RISK TOO LOW Tolerable Deviation Rate 2% 114 194 194 265 398 708 1,463 3% 76 129 129 129 176 221 265 390 590 974 4% 57 96 96 96 96 132 132 166 198 262 353 471 730 1,258 5% 45 77 77 77 77 77 105 105 132 132 158 209 258 306 400 583 873 6% 38 64 64 64 64 64 64 88 88 88 110 132 132 153 194 235 274 1,019 7% 32 55 55 55 55 55 55 55 75 75 75 94 94 113 113 131 149 318 1,150 8% 28 48 48 48 48 48 48 48 48 65 65 65 65 82 82 98 98 25 42 42 42 42 42 42 42 42 42 58 58 58 58 73 73 73 160 115 349 182 385 1,300 9% ··· 1,437 10% 22 38 38 38 38 38 38 38 38 38 38 52 52 52 52 52 65 78 116 199 424 1,577 15% 15 25 25 25 25 25 25 25 25 25 25 25 25 25 25 25 25 34 43 52 60 77 100 368 20% 11 18 18 18 18 18 18 18 18 18 18 18 18 18 18 18 ---***AKCES 18 18 25 25 25 32 38 63 126 457 Sample size is too large to be cost effective for most audit applications. Source: American Institute of Certified Public Accountants, "Audit Sampling", Audit and Accounting Guide (New York: AICPA, 2008) Note: This table assumes a large population. Sample sizes greater than 2,000 not shown TABLE 2 Sample Size 20 25 30 35 40 Note: 45 50 55 60 65 70 75 80 90 100 SAMPLE EVALUATION TABLE FOR 5 PERCENT RISK OF ASSESSING CONTROL RISK TOO LOW Actual Number of Deviations Found 125 1 2 14.0 21.7 28.3 11.3 17.5 23.2 9.6 14.9 19.6 8.3 12.9 17.0 7.3 11.4 15.0 6.5 10.2 13.4 5.9 9.2 12.1 5.4 8.4 11.1 7.7 10.2 7.1 9.4 6.6 8.8 6.2 8.2 5.8 7.7 6.9 6.2 5.0 4.2 3.2 2.1 1.6 2.0 1.3 1.6 ∞ 9999653838 4.9 4.6 4.2 4.0 3.7 3 10 34.4 40.2 69.9 28.2 33.0 58.4 23.9 28.0 31.9 35.8 39.4 43.0 46.6 50.0 20.7 24.3 27.8 31.1 34.4 37.5 40.6 43.7 18.3 21.5 24.6 27.5 30.4 33.3 36.0 38.8 16.4 19.2 22.0 24.7 27.3 29.8 32.4 34.8 14.8 17.4 19.9 22.4 29.4 31.6 13.5 15.9 18.2 20.5 26.9 28.9 12.5 14.7 16.8 18.8 24.8 26.7 11.5 13.6 15.5 17.5 23.0 24.7 10.8 12.7 14.5 16.3 21.4 28.1 10.1 11.8 13.6 15.2 16.9 18.5 20.1 21.6 9.5 11.1 12.7 14.3 15.9 17.4 18.9 20.3 11.4 12.8 14.2 15.5 16.9 18.2 10.3 11.5 12.8 14.0 15.2 16.4 8.3 9.3 10.3 11.3 12.3 13.2 6.9 7.8 8.6 9.5 10.3 11.1 5.2 5.8 6.5 7.2 7.8 8.4 3.5 4.0 4.4 4.8 5.2 5.6 2.7 3.0 3.3 3.6 3.9 4.3 2.1 2.4 2.7 2.9 3.2 3.4 3.0 5.2 4.7 3.8 150 2.0 3.2 200 1.5 2.4 300 1.0 1.6 400 0.8 1.2 500 0.6 1.0 ULDR exceeds 20 percent. Source: American Institute of Certified Public Accountants, "Audit Sampling", Audit and Accounting Guide (New York: AICPA, 2008) This table presents ULDRs as percentages and assumes a large population. TABLE 3 2.4 8.4 7.6 6.1 5.1 3.9 2.6 9.9 9.0 7.2 6.0 4.6 3.1 2.3 1.9 45.6 37.6 7 8 55.9 60.7 46.3 50.4 50.8 42.0 24.7 27.1 22.6 24.8 20.8 22.8 19.3 21.2 18.0 19.7 9 65.4 54.4 Sample Size 9 61.6 50.8 7.4 12.4 16.8 21.0 24.9 28.8 39.7 43.2 6.4 10.7 14.5 18.2 21.6 24.9 28.2 31.4 34.5 37.6 5.6 9.4 12.8 16.0 19.0 22.0 24.9 27.7 30.5 33.2 5.0 8.4 11.4 14.3 17.0 19.7 22.3 24.8 27.3 29.8 4.6 7.6 10.3 12.9 15.4 17.8 20.2 22.5 24.7 27.0 4.2 6.9 9.4 11.8 14.1 16.3 18.4 20.5 22.6 24.6 3.8 6.4 8.7 10.8 12.9 15.0 16.9 18.9 20.8 22.7 3.5 5.9 8.0 10.0 12.0 13.9 15.7 17.5 19.3 21.0 3.3 5.5 7.5 11.1 12.9 14.6 16.3 18.0 19.6 3.1 5.1 7.0 10.4 12.1 13.7 15.2 16.8 18.3 2.9 4.8 6.6 9.8 11.3 12.8 14.3 15.8 17.2 2.6 4.3 5.9 8.7 10.1 11.5 12.8 14.1 15.4 2.3 3.9 5.3 7.9 9.1 10.3 11.5 12.7 13.9 1.9 3.1 4.3 6.3 7.3 8.3 9.3 10.2 11.2 1.6 2.6 3.6 5.3 6.1 7.0 7.8 8.6 1.2 2.0 2.7 4.0 4.6 5.3 5.9 6.5 300 0.8 1.3 1.8 2.7 3.1 3.5 3.9 4.3 400 0.6 1.0 1.4 2.0 2.4 2.7 3.0 3.3 500 0.5 0.8 1.1 1.6 1.9 2.1 2.4 2.6 ULDR exceeds 20 percent. SAMPLE EVALUATION TABLE FOR 10 PERCENT RISK OF ASSESSING CONTROL RISK TOO LOW Actual Number of Deviations Found 20 25 30 35 40 45 50 55 60 65 70 75 80 90 100 125 150 200 0 ON 10.9 8.8 20 1 2 18.1 24.5 14.7 20.0 3 30.5 24.9 4 5 6 36.1 41.5 46.8 29.5 34.0 9.3 8.7 8.2 7.3 6.6 5.3 4.4 3.4 2.3 1.7 1.4 7 51.9 38.4 42.6 32.5 36.2 8 56.8 46.8 9.4 7.1 4.7 3.6 2.9 10 66.2 54.8 46.7 40.6 35.9 32.2 29.2 26.7 24.6 22.8 21.2 19.8 18.7 16.7 15.0 12.1 10.1 7.6 5.1 3.9 3.1 Source: American Institute of Certified Public Accountants, "Audit Sampling", Audit and Accounting Guide (New York: AICPA, 2008) Note: This table presents ULDRs as percentages and assumes a large population. TABLE 4 BRENDA, INC. SPECIFIC INTERNAL CONTROL PROCEDURES TO BE TESTED BY STARR, CPA (a) Departments requesting purchases should prepare a Purchase Requisition. (b) The requisitions should be approved by the Purchasing Agent through the preparation of a Purchase Order. Expected Deviation Rate 0.00% 0.25 0.50 0.75 1.00 1.25 1.50 1.75 2.00 2.25 2.50 2.75 3.00 3.25 3.50 3.75 4.00 5.00 6.00 7.00 8.00 9.00 10.00 12.50 15.00 17.50 SAMPLE SIZE TABLE FOR 5 PERCENT RISK OF ASSESSING CONTROL RISK TOO LOW Tolerable Deviation Rate 149 236 313 386 590 1,030 3% 99 157 157 208 257 303 392 562 846 1,466 4% 5% 74 59 117 93 117 93 117 93 156 93 156 124 192 124 227 153 294 181 390 208 513 234 722 286 1,098 361 1,936 458 624 877 1,348 49 78 78 78 78 78 103 103 127 127 150 173 195 238 280 341 421 1,580 7% 42 66 66 66 66 66 66 88 88 88 109 109 129 148 167 185 221 478 1,832 . 8% 36 58 58 58 58 58 58 77 77 77 77 95 95 112 112 129 146 240 532 . . 9% 32 51 51 51 51 51 51 51 68 68 68 68 84 84 84 100 100 158 266 585 * 10% 29 46 46 46 46 46 994556TORRE 61 61 61 61 61 76 76 89 116 179 298 649 15% 20% 19 30 30 30 30 30 30 30 30 30 30 30 30 30 40 40 40 40 50 68 85 110 150 576 NNNNNNNNNNNNNNNNAARRER 22 22 22 22 22 22 22 22 22 30 30 37 37 44 50 88 193 720 Sample size is too large to be cost effective for most audit applications. Source: American Institute of Certified Public Accountants, "Audit Sampling", Audit and Accounting Guide (New York: AICPA, 2008) Note: This table assumes a large population. Sample sizes greater than 2,000 not shown TABLE 1 Expected Deviation Rate 0.00% 0.25 0.50 0.75 1.00 1.25 1.50 1.75 2.00 2.25 2.50 2.75 3.00 3.25 3.50 3.75 4.00 5.00 6.00 7.00 8.00 9.00 10.00 12.50 15.00 17.50 SAMPLE SIZE TABLE FOR 10 PERCENT RISK OF ASSESSING CONTROL RISK TOO LOW Tolerable Deviation Rate 2% 114 194 194 265 398 708 1,463 3% 76 129 129 129 176 221 265 390 590 974 4% 57 96 96 96 96 132 132 166 198 262 353 471 730 1,258 5% 45 77 77 77 77 77 105 105 132 132 158 209 258 306 400 583 873 6% 38 64 64 64 64 64 64 88 88 88 110 132 132 153 194 235 274 1,019 7% 32 55 55 55 55 55 55 55 75 75 75 94 94 113 113 131 149 318 1,150 8% 28 48 48 48 48 48 48 48 48 65 65 65 65 82 82 98 98 25 42 42 42 42 42 42 42 42 42 58 58 58 58 73 73 73 160 115 349 182 385 1,300 9% ··· 1,437 10% 22 38 38 38 38 38 38 38 38 38 38 52 52 52 52 52 65 78 116 199 424 1,577 15% 15 25 25 25 25 25 25 25 25 25 25 25 25 25 25 25 25 34 43 52 60 77 100 368 20% 11 18 18 18 18 18 18 18 18 18 18 18 18 18 18 18 ---***AKCES 18 18 25 25 25 32 38 63 126 457 Sample size is too large to be cost effective for most audit applications. Source: American Institute of Certified Public Accountants, "Audit Sampling", Audit and Accounting Guide (New York: AICPA, 2008) Note: This table assumes a large population. Sample sizes greater than 2,000 not shown TABLE 2 Sample Size 20 25 30 35 40 Note: 45 50 55 60 65 70 75 80 90 100 SAMPLE EVALUATION TABLE FOR 5 PERCENT RISK OF ASSESSING CONTROL RISK TOO LOW Actual Number of Deviations Found 125 1 2 14.0 21.7 28.3 11.3 17.5 23.2 9.6 14.9 19.6 8.3 12.9 17.0 7.3 11.4 15.0 6.5 10.2 13.4 5.9 9.2 12.1 5.4 8.4 11.1 7.7 10.2 7.1 9.4 6.6 8.8 6.2 8.2 5.8 7.7 6.9 6.2 5.0 4.2 3.2 2.1 1.6 2.0 1.3 1.6 ∞ 9999653838 4.9 4.6 4.2 4.0 3.7 3 10 34.4 40.2 69.9 28.2 33.0 58.4 23.9 28.0 31.9 35.8 39.4 43.0 46.6 50.0 20.7 24.3 27.8 31.1 34.4 37.5 40.6 43.7 18.3 21.5 24.6 27.5 30.4 33.3 36.0 38.8 16.4 19.2 22.0 24.7 27.3 29.8 32.4 34.8 14.8 17.4 19.9 22.4 29.4 31.6 13.5 15.9 18.2 20.5 26.9 28.9 12.5 14.7 16.8 18.8 24.8 26.7 11.5 13.6 15.5 17.5 23.0 24.7 10.8 12.7 14.5 16.3 21.4 28.1 10.1 11.8 13.6 15.2 16.9 18.5 20.1 21.6 9.5 11.1 12.7 14.3 15.9 17.4 18.9 20.3 11.4 12.8 14.2 15.5 16.9 18.2 10.3 11.5 12.8 14.0 15.2 16.4 8.3 9.3 10.3 11.3 12.3 13.2 6.9 7.8 8.6 9.5 10.3 11.1 5.2 5.8 6.5 7.2 7.8 8.4 3.5 4.0 4.4 4.8 5.2 5.6 2.7 3.0 3.3 3.6 3.9 4.3 2.1 2.4 2.7 2.9 3.2 3.4 3.0 5.2 4.7 3.8 150 2.0 3.2 200 1.5 2.4 300 1.0 1.6 400 0.8 1.2 500 0.6 1.0 ULDR exceeds 20 percent. Source: American Institute of Certified Public Accountants, "Audit Sampling", Audit and Accounting Guide (New York: AICPA, 2008) This table presents ULDRs as percentages and assumes a large population. TABLE 3 2.4 8.4 7.6 6.1 5.1 3.9 2.6 9.9 9.0 7.2 6.0 4.6 3.1 2.3 1.9 45.6 37.6 7 8 55.9 60.7 46.3 50.4 50.8 42.0 24.7 27.1 22.6 24.8 20.8 22.8 19.3 21.2 18.0 19.7 9 65.4 54.4 Sample Size 9 61.6 50.8 7.4 12.4 16.8 21.0 24.9 28.8 39.7 43.2 6.4 10.7 14.5 18.2 21.6 24.9 28.2 31.4 34.5 37.6 5.6 9.4 12.8 16.0 19.0 22.0 24.9 27.7 30.5 33.2 5.0 8.4 11.4 14.3 17.0 19.7 22.3 24.8 27.3 29.8 4.6 7.6 10.3 12.9 15.4 17.8 20.2 22.5 24.7 27.0 4.2 6.9 9.4 11.8 14.1 16.3 18.4 20.5 22.6 24.6 3.8 6.4 8.7 10.8 12.9 15.0 16.9 18.9 20.8 22.7 3.5 5.9 8.0 10.0 12.0 13.9 15.7 17.5 19.3 21.0 3.3 5.5 7.5 11.1 12.9 14.6 16.3 18.0 19.6 3.1 5.1 7.0 10.4 12.1 13.7 15.2 16.8 18.3 2.9 4.8 6.6 9.8 11.3 12.8 14.3 15.8 17.2 2.6 4.3 5.9 8.7 10.1 11.5 12.8 14.1 15.4 2.3 3.9 5.3 7.9 9.1 10.3 11.5 12.7 13.9 1.9 3.1 4.3 6.3 7.3 8.3 9.3 10.2 11.2 1.6 2.6 3.6 5.3 6.1 7.0 7.8 8.6 1.2 2.0 2.7 4.0 4.6 5.3 5.9 6.5 300 0.8 1.3 1.8 2.7 3.1 3.5 3.9 4.3 400 0.6 1.0 1.4 2.0 2.4 2.7 3.0 3.3 500 0.5 0.8 1.1 1.6 1.9 2.1 2.4 2.6 ULDR exceeds 20 percent. SAMPLE EVALUATION TABLE FOR 10 PERCENT RISK OF ASSESSING CONTROL RISK TOO LOW Actual Number of Deviations Found 20 25 30 35 40 45 50 55 60 65 70 75 80 90 100 125 150 200 0 ON 10.9 8.8 20 1 2 18.1 24.5 14.7 20.0 3 30.5 24.9 4 5 6 36.1 41.5 46.8 29.5 34.0 9.3 8.7 8.2 7.3 6.6 5.3 4.4 3.4 2.3 1.7 1.4 7 51.9 38.4 42.6 32.5 36.2 8 56.8 46.8 9.4 7.1 4.7 3.6 2.9 10 66.2 54.8 46.7 40.6 35.9 32.2 29.2 26.7 24.6 22.8 21.2 19.8 18.7 16.7 15.0 12.1 10.1 7.6 5.1 3.9 3.1 Source: American Institute of Certified Public Accountants, "Audit Sampling", Audit and Accounting Guide (New York: AICPA, 2008) Note: This table presents ULDRs as percentages and assumes a large population. TABLE 4
Expert Answer:
1 A deviation would be the purchaser creating a purchase order without a requisition from any person ... View the full answer
Auditing A Practical Approach
ISBN: 978-1119566007
3rd Canadian edition
Authors: Robyn Moroney, Fiona Campbell, Jane Hamilton, Valerie Warren
Students also viewed these mathematics questions
-
You have been assigned to perform tests of controls on the sales system at EDB Ltd. as part of the December 31, 2020, audit. EDB is a wholesaler of bathroom supplies such as vanity units, toilets,...
-
What would you consider to be possibly the most important factor in reducing the cost of implementing project management?
-
What would you consider to be the financial equivalent of Maslow's hierarchy of needs? What are the basics? What comes last?
-
Draw Lewis structures for the AsCl4+ and AsCl6- ions. What type of reaction (acidbase, oxidationreduction, or the like) is the following? 2AsCl5(g) AsCl4AsCl6(s)
-
The region of Problem 27 is revolved about the y-axis. Find the volume of the resulting solid. In problem 27 The region bounded by y = 1/(x2+2x+5), y = 0, x = 0, and x = 1, is revolved about the...
-
Kawasaki Motors Corporation (Kawasaki), a Japanese corporation, manufactures motorcycles that it distributes in the United States through its subsidiary, Kawasaki Motors Corporation, U. S. A....
-
In Pittsburgh, Pennsylvania, about 56% of the days in a year are cloudy. Find the mean, variance, and standard deviation for the number of cloudy days during the month of June. Interpret the results...
-
Target Corporation prepares its financial statements according to U.S. GAAP. Targets financial statements and disclosure notes for the year ended February 3, 2018, are available in Connect. This...
-
Explain the systematic process of continuous improvement What is a training needs analysis and how are they used? How can you present improvements to the work team and management? What is quality and...
-
Penny Stafford, the owner of Belvi Coffee and Tea Exchange, located in Bellevue, Washington, brought an antitrust suit against Starbucks. She alleged that through its exclusive leases, Starbucks bans...
-
xz-plane divides the join of the point (2,3,4) and (1,-1,5) in the ratio 1:). Find: The value of 1.
-
Do a Partial Multiple Step Income Statement (through Gross Profit) using the following accounts from Tescana, Inc. for the month that ended January 31, 2024. Name of Account Balance Beginning...
-
Perform a Competitive Analysis using the specific company's closest three competitors plus the selected company. Explain why these companies are competitors. Analyze the competition's products and...
-
XYZ Corp.'s outstanding bonds have a $10,000 par value and they mature in 10 years. Their yield-to-maturity is 8%, annual coupon rate is 6%, and semi-annual compounding. (a) What's the bond's current...
-
Prepare and submit a table summarizing the major differences and similarities of these different delivery system agreements. The different delivery systems agreements are Design-Bid-Build,...
-
You buy a 5-year, 8 percent coupon bond at par, $100, and hold it for three years. When you sell the bond, the interest rate is 7 percent. What is the annualized holding period yield?
-
Describe the end behavior of the graph of the polynomial function. f(x)=-6x+5x-1
-
Write a paper about the Working relationship in the organization- collaboration within and outside the organization
-
1) The area of specialization in neuroscience that investigates the behavioral consequences of disorders of the nervous system is? A) Neuroanatomy B) Behavioral neuroscience C) Neuropsychology D)...
-
Your firm is the auditor of Daybrook Insurance Brokers Ltd., which operates from a number of branches and provides insurance for the general public and businesses. The company obtains insurance from...
-
Why is the control risk assessment of the completeness of cash receipts and sales adjustment transactions associated with the control risk over the existence of the accounts receivable balance?
-
Explain why the balance of cash on hand and at bank is always audited, and why a substantive approach is preferred.
-
On Cartesian axes, the x-component of a vector is generally associated with a (a) cosine, (b) sine, (c) tangent, (d) none of the foregoing.
-
What process do you follow to make decisions for these different circumstances, and are you satisfied with the results?
-
A football is thrown on a long pass. Compared to the balls initial horizontal velocity component, the velocity at the highest point is (a) greater, (b) less, (c) the same.
Study smarter with the SolutionInn App