

Suppose that the economy of Witland in the figure below is at full-employment equilibrium and the present
Question:
Suppose that the economy of Witland in the figure below is at full-employment equilibrium and the present nominal wage rate is $20 per hour. Round your answers to two decimal places.
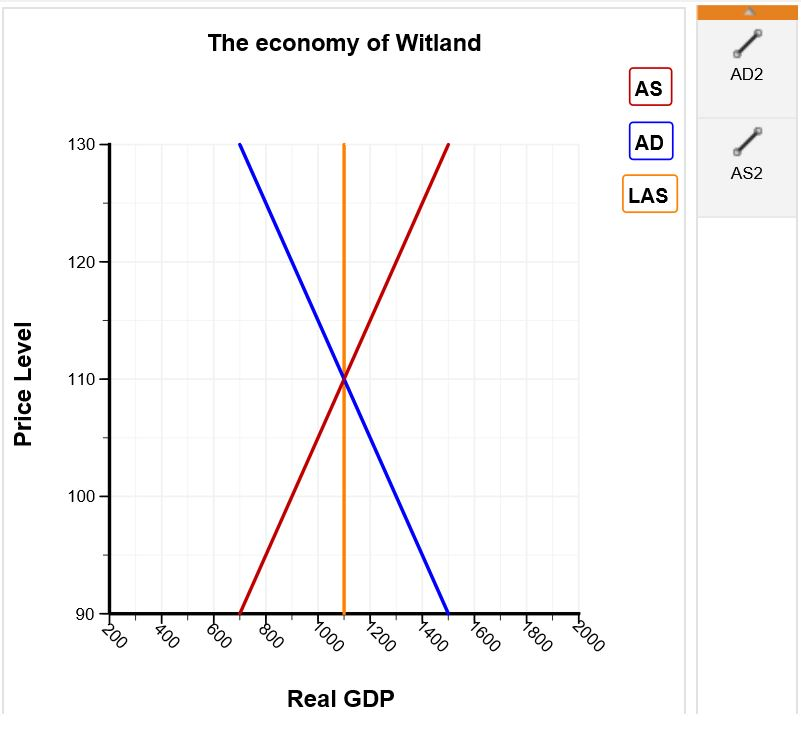
a. The real wage rate (in base year prices) is $______________ .
b) Suppose that aggregate demand increases by $400. Draw the new AD curve in the graph above. Plot only the endpoints of the curve.
c) At the new equilibrium real GDP level, the value of the real wage rate will be $__________ . d) As a result of the change in prices in b), suppose that nominal wage increases, causing aggregate supply to change by $400. Draw the new AS curve in the graph above. Plot only the endpoints of the curve.
Expert Answer:
a Nominal wage rate 20 per hour Price level in current year 110 Price level in base ye... View the full answer


Mathematical Applications for the Management Life and Social Sciences
ISBN: 978-1305108042
11th edition
Authors: Ronald J. Harshbarger, James J. Reynolds
