

Question: Table 1: An academic awareness task force at a Big-Ten university sampled 200 students to ask them whether they studied or did not study the
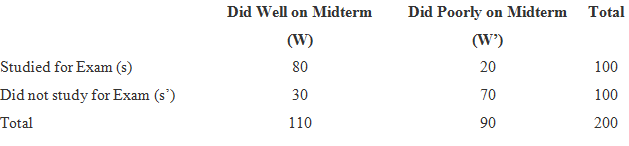
Table 1:
An academic awareness task force at a Big-Ten university sampled 200 students to ask them whether they studied or did not study the weekend before the midterm. The following result was obtained:
The probability tree is shown in FIGURE 1.
Referring to Table and Figure 1, the P(W | S) is:
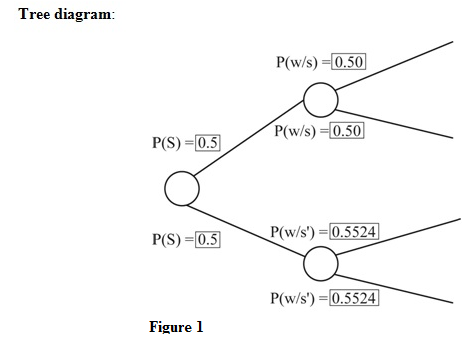
Studied for Exam (s) Did not study for Exam (s') Total Did Well on Midterm (W) 80 30 110 Did Poorly on Midterm (W') 20 70 90 Total 100 100 200 Tree diagram: P(S) = 0.5 P(S)=0.5 Figure 1 P(w/s)=0.50 P(w/s)=0.50 P(w/s')=0.5524 P(w/s') = 0.5524
Step by Step Solution
3.36 Rating (146 Votes )
There are 3 Steps involved in it
To find the probability PW S which is the probabili... View full answer

Get step-by-step solutions from verified subject matter experts
Document Format (2 attachments)
60923dfe7f13f_22867.pdf
180 KBs PDF File
60923dfe7f13f_22867.docx
120 KBs Word File