

Question: Take a good look at engine fuel consumption map. Explain the various different features of the graph/figure. Add a curve corresponding to 30 km/h per
Take a good look at engine fuel consumption map. Explain the various different features of the graph/figure. Add a curve corresponding to 30 km/h per 1000 rpm to the existing figure and spot (approximately) the speed of 120 km/h. Consider this speed as top speed, and identify the corresponding engine rpm, bmep, engine torque and swept volume. 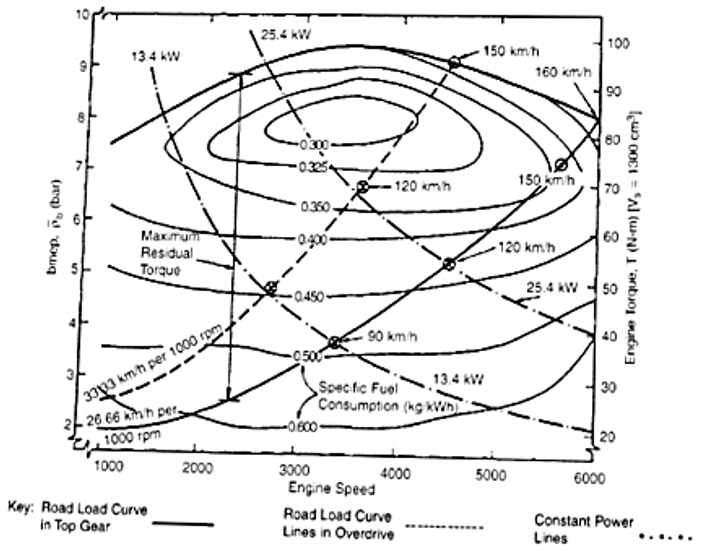
bmep. P (bar) 10 9 B 160 13.4 KW 1000 Maximum Residual, Torque 3333 km/h per 1000 rpm. 26 66 kmh per 1000 rpm Key: Road Load Curve in Top Gear 2000 25.4 KW 300 0.325 0.350 -0.400- -0.450 -0.500 -0.600 3000 120 km/h 90 km/h Engine Speed Specific Fuel Consumption (kg/kWh) 4000 Road Load Curve Lines in Overdrive 150 km/h 13.4 kW 160 kmh 5000 150 km h 120 kmh 25.4 KW 100 90 8 50 30 20 6000 Engine Torque, T (N-m) [V, 1300 cm] Constant Power Lines
Step by Step Solution
3.43 Rating (162 Votes )
There are 3 Steps involved in it
Features of the Engine Fuel Consumption Map 1 Axes Xaxis Engine Speed in RPM Shows how fast the engi... View full answer

Get step-by-step solutions from verified subject matter experts