

Question: The Data Bank is found in Appendix D, or on the World Wide Web by following links from www.mhhe.com/mathistatibluman Data Bank Values This list explains
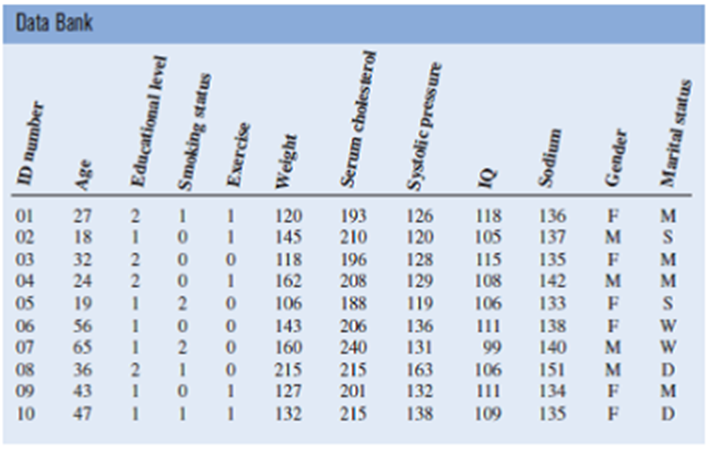
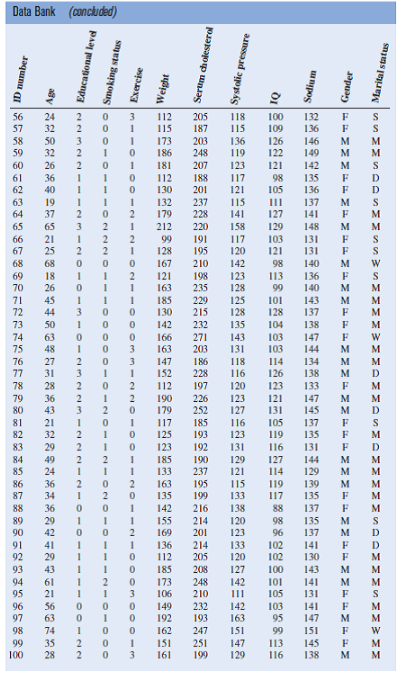
The Data Bank is found in Appendix D, or on the World Wide Web by following links from www.mhhe.com/mathistatibluman Data Bank Values
This list explains the slicks go en for the cab:goats in the Data Bank.
1. ''Age" is given in years.
2. "Educational level" values are defined as follows:
0 = no high school degree
1 = high school graduate
2 = collage graduate
3 = graduate degree
3. ''Smoking status" values are defined as follows:
0 = does not smoke
1 = stokes less than one pack per day
2 = smokes one or more then one pack per day
4. "Exercise" values are defined as follows:
0 = none
1 = light
2 moderate
3 = heavy
5. ''Weight'' is given in pounds.
6. "Serum cholesterol" is given in milligram percent (mg%).
7. "Systolic pressure" is given in millimeters of mercury (mm Hg.)
8. "IQ'' Is given in standard IQ test score values.
9. ''Sodium" is given in milliequivalents per liter (mEq/1).
10. ''Gender'' is listed as made (M) or female (F).
11. ''Marital status'' values are defined as follows:
M = married
W = widowed
S = single
D = divorced
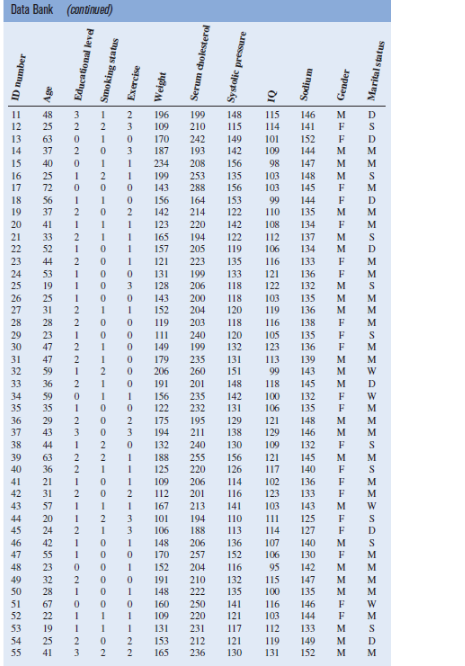
From the Data Bank, choose a sample and use the sign test to test one of the following hypotheses.
a. For serum cholesterol, test HO: median = 220 milligram percent (mg96).
b. For systolic pressure, test HO: median =120 millimeters of mercury (mm Hg).
c. For 10, test HO: median = 100.
d. For sodium level, test HO: median = 140 mEq/1.
The sign test
Single-Sample Sign Test
The simplest non-parametric test, the sign test for single samples, is used to test the value of a median for a specific sample. When using the sign test, the researcher hypothesizes the specific value for the median of a population; then he or she selects a sample of data and compares each value with the conjectured median. If the data value is above the conjectured median, it is assigned a plus sign. If it is below the conjectured median, it is assigned a minus sign. And if it is exactly the same as the conjectured median, it is assigned a 0. Then the numbers of plus and minus signs are compared. If the null hypothesis is true, the number of plus signs should be approximately equal to the number of minus signs. If the null hypothesis is not true, there will be a disproportionate number of plus or minus signs.
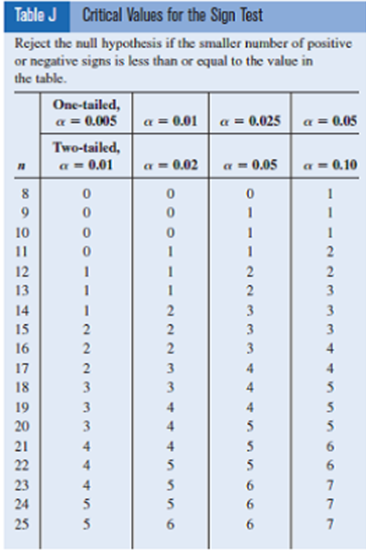
Test Value for tho Sign Tom The test value Is the smaller number of plus or mules signs.
For example, if there are 8 positive signs and 3 negative signs, the test value is 3. When the sample size is 25 or less, Table J in Appendix C is used to determine the critical value. For a specific a, if the test value is less than or equal to the critical value obtained from the table, the null hypothesis should be rejected. The values in Table J are obtained from the binomial distribution. The derivation is omitted here.
Data Bank ID number 5889882839 54852 Age 1 1 1 2 1 1 -NN- Educational level 0 Smoking status Exercise 1 0 1 0 0 0 0 1 1 Weight 162 106 Serum cholesterol 188 206 Systolic pressure Sodium 142 133 138 140 TANTIN Gender CHUMENNESK Marital status Data Bank (continued) ID number HDBHSED%2858339853885883285329=9934444285 11 12 13 14 15 16 17 18 19 20 21 26 27 30 31 36 37 40 41 46 47 50 51 52 53 54 55 ARTROKKNUAREUHKOIAKUKAANNUNJUKKNK Age 31 20 24 Educational level NO--000000-N-CO-NOOO-----0-0000--0--0--Smoking status 3 - - - - - . 2 0 2 0 0 1 2 1 2 1 2 1 1 1 2 2 1 2 2 1 2 0 1 2 3 1 2 2 1 2 1 1 2 1 1 102101123 Exercise Weight 0 3 199 3 2 196 109 210 170 242 187 193 234 208 199 253 143 288 156 164 142 1 1 0 0 2 1 1 1 1 0 3 0 143 200 1 152 204 0 119 203 Serum cholesterol 131 128 3 0 8839 123 220 165 194 157 205 121 223 0 111 240 0 149 199 DIOIOII22 0 179 235 0 206 260 0 0 191 201 1 156 235 0 122 232 2 175 195 194 211 132 240 214 122 199 206 1 109 1 188 255 1 125 220 1 109 206 2 112 201 1 167 213 3 101 194 3 106 188 1 148 206 0 170 257 1 152 204 0 191 210 1 148 222 160 1 131 250 220 231 and 8885599-88888=2 153 212 2 165 236 142 148 142 115 114 98 101 152 109 144 103 103 99 Sodium 146 141 147 113 99 118 100 106 148 110 108 112 106 116 133 121 136 122 145 144 F 135 M 134 137 134 116 105 135 123 136 139 143 145 F F 132 M 103 135 M 119 136 M 138 F 132 135 M F F M M M F 121 129 109 121 117 102 123 103 111 125 114 127 107 140 106 130 95 142 115 147 100 135 116 146 103 144 112 133 119 149 131 152 148 146 132 145 140 F M M 136 133 143 F F M M M F F M F M F F M F F M F M M M M F F M MARSHMOURZORUZZO Marital status M D M D F S D S MMWAWMMMMMMMMMMMMMMMM D S S D S S D Data Bank (concluded) Thuntu am 56 57 58 50 dB 5 6012 B45%5%89 100 59 60 61 62 63 64 65 66 67 68 69 70 71 72 73 74 75 76 77 78 79 80 81 82 83 86 87 88 90 91 92 93 96 97 32 24 2 0 2 50 32 26 36 40 19 37 65 21 25 68 18 26 45 44 50 63 48 27 31 28 36 43 21 32 29 49 24 36 34 36 29 42 41 29 43 61 21 56 63 74 35 28 101001OIOININNN-WNNWN-O-W-O-ON-WN--INNE 3 2 2 2 3 2 2 Educational level 2 0001OINIIIOIONOINIIONIO-OOOOOII-ONNNOIIIOIOOSmoking status Exercise Weight 10100ININ-ON-IO00mm-NNO-OOIINOII2Iooomo0o-3 112 118 205 1 115 187 115 173 203 136 121 163 185 130 142 166 163 147 152 186 248 119 122 181 207 123 121 112 188 117 98 130 201 121 105 132 237 179 228 141 127 212 220 158 129 99 191 117 103 128 195 121 167 210 98 198 113 235 99 229 101 215 128 232 104 112 190 179 117 125 123 185 133 163 135 142 155 169 136 112 Serum cholesterol 185 173 106 149 192 162 161 186 228 197 226 2828=3885626065 Systolic pressure 271 143 203 131 208 248 210 232 193 142 252 185 193 192 131 190 237 195 199 216 214 201 214 205 247 251 199 127 116 129 121 115 133 138 120 123 133 120 100 132 136 109 126 146 149 142 135 136 103 103 Sodium 98 96 136 140 143 137 138 147 144 134 138 133 142 103 163 151 147 129 137 141 148 131 131 140 M F M 147 145 137 135 131 137 135 137 102 141 102 130 Gender 114 126 123 F 121 M 131 M 105 F 119 F 116 F 127 144 M 114 129 M 119 139 M 117 135 F 88 127 100 143 142 111 F F M M M F F M F M F F M F F F M M M F M M F F M 101 141 105 131 141 95 147 99 151 113 145 116 138 M M F F M F ZEMESEKKUUSEKEEKURSUZUKEREKENESSES Marital status Table J Critical Values for the Sign Test Reject the null hypothesis if the smaller number of positive or negative signs is less than or equal to the value in the table. 11 8 9 10 11 12 13 HSDDK2858333 14 15 16 17 18 19 20 21 22 24 One-tailed, a = 0.005 Two-tailed, a = 0.01 0 0 0 1 1 2 2 2 3 3 3 4 4 4 5 5 a = 0.01 a=0.02 0 0 1 1 1 2 2 2 3 3 4 4 5 5 5 6 a = 0.025 a = 0.05 a = 0.05 0 1 1 2 2 3 3 3 4 4 4 5 5 6 6 a = 0.10 1 1 2 2 3 3 3 4 4 5 5 6 6 7 7 7
Step by Step Solution
There are 3 Steps involved in it
To perform the sign test for one of the hypotheses lets choose hypothesis a For serum cholesterol te... View full answer

Get step-by-step solutions from verified subject matter experts