

The figure shows the demand for money curve and the supply of money curve. Draw a new
Question:
The figure shows the demand for money curve and the supply of money curve. Draw a new MD curve that shows the effect of an increase in real GDP. Label it MD 1 .
Draw a point at the new equilibrium quantity of money and interest rate.
The equilibrium interest rate before real GDP increases is _____ 9 percent a year.
After real GDP increases. at an interest rate of 4 percent a year. people want to hold _____ money so they ______ bonds.
A. Less; sell
B. The same quantity of; buy some bonds and sell some
C. Less; buy
D. more; sell
E. more; buy
The price of a bond ______ and the interest rate ______ .
A. falls; rises B. rises; rises
C. rises; falls
D. does not change; does not change
E. falls; falls
Nominal Interest rate (percent per year)
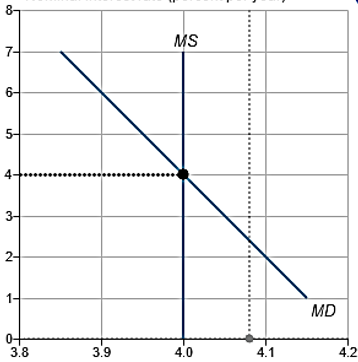
Quantity of money (trillions of dollars)
(4.08,0)
>>> Draw only the objects specified in the question.
Expert Answer:


