

The following graph shows the daily market for wine. Suppose the government institutes a tax of $46.40
Fantastic news! We've Found the answer you've been seeking!
Question:
The following graph shows the daily market for wine. Suppose the government institutes a tax of $46.40 per bottle. This places a wedge between the price buyers pay and the price sellers receive.
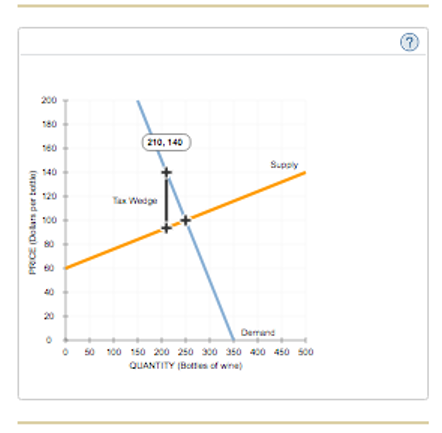
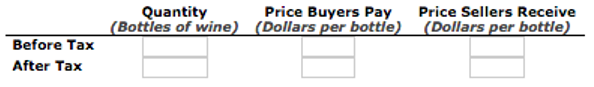
Fill in the following table with the quantity sold, the price buyers pay, and the price sellers receive before and after the tax.
Using the data you entered in the previous table, calculate the tax burden that falls on buyers and on sellers, respectively, and calculate the price elasticity of demand and supply over the relevant ranges using the midpoint method. Enter your results in the following table.
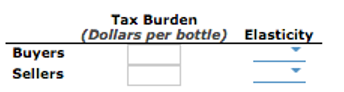
The burden of the tax falls more heavily on the _______ elastic side of the market.
Expert Answer:
quantity price buye pay price seller receive before tax 250 100 100 after tax 21... View the full answer

Related Book For 

Posted Date:
