

The following is the information from section 9.7 the question is on the bottom: Figure: Effect of
Question:
The following is the information from section 9.7 the question is on the bottom:
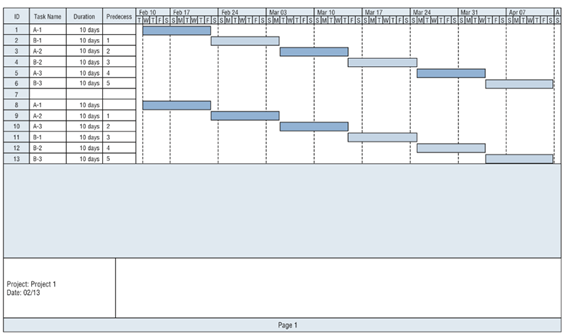
Figure: Effect of multitasking on project completion given fixed activity times.
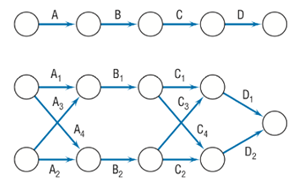
Figure: Two levels of 40-day network complexity.
But let's get a bit more real. Assume that each activity is stochastic, with normally distributed times. The mean time is 10 days, and the standard deviation is 3 days. If we simulate the projects 500 times, we get the results shown in Tables 9-4 and 9-5. Table 9-4, covering the simulation of the simple network, shows (as we expected) a mean project completion time of about 40 days. Table 9-5 covers the simulation of the complex network, and its mean completion time is about 46 days. Complexity, uncertainty, and merging paths all join to make trouble.
6. People need a reason to work hard:
Senior managers of our acquaintance have been known to argue that project workers?and they include project managers in that category?"always" have enough slack time in their activity duration estimates to make sure that they can complete the activities on time and "without too much sweat." Therefore, it makes some managerial sense to cut back on the time allowances until they can serve as an incentive to the project team. It has, however, long been known that for people with a high need for achievement, the maximum level of motivation is associated with only moderate, not high, levels of risk of failure.
7. Game playing:
This is possibly the most common cause of late projects. It is certainly a major cause of frustration for anyone involved in a project. Senior managers, firm in the belief that
Please answer the following question
A simulation model was developed in Section 9.7 to illustrate the problem with assuming activity times were known with certainty. However, in the simulation analysis, the activity times were assumed to be normally distributed. Do you have any concerns with assuming that the activity times were normally distributed? Redo the simulation analysis using a BetaPERT distribution with parameters of 7, 10, and 15 for the optimistic, most likely, and pessimistic times estimates. How do the results compare with the results obtained using a normal distribution?
Expert Answer:
In CPM method activities were assumed to be normally distributed with mean duration of 10 ... View the full answer


Financial Reporting and Analysis
ISBN: 978-0078025679
6th edition
Authors: Flawrence Revsine, Daniel Collins, Bruce, Mittelstaedt, Leon
