

The following table reports real income per person for several different economies in the years 1960 and
Question:
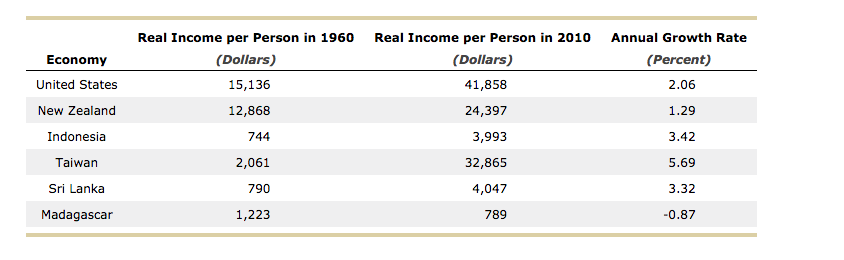
The following table reports real income per person for several different economies in the years 1960 and 2010. It also gives each economy's average annual growth rate during this period. For example, real income per person in Madagascar was $1,223 in 1960, and it actually declined to $789 by 2010. Madagascar's average annual growth rate during this period was -0.87%, and it was the poorest economy in the table in the year 2010.
The real income-per-person figures are denominated in U.S. dollars with a base year of 2005. The following exercises will help you to understand the different growth experiences of these economies.
Indicate which economy satisfies each of the following statements.
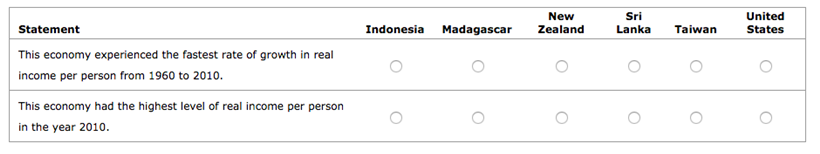
Consider the following list of four countries. Which economy began with a level of real income per person in 1960 that was well below that of New Zealand and grew fast enough to catch up with and surpass New Zealand's real income per person by 2010?
- Indonesia
- Sri Lanka
- Taiwan
- United States
Expert Answer:


Statistics for Business and Economics
ISBN: 978-0321826237
12th edition
Authors: James T. McClave, P. George Benson, Terry T Sincich
