

Question: The scatterplot and the data table below show. For 2008 cars, the carbon footprint (tons of CO 2 per year) vs. highway mileage for 20
The scatterplot and the data table below show. For 2008 cars, the carbon footprint (tons of CO 2 per year) vs. highway mileage for 20 family sedans.
a) The correlation is ? 0.763. Describe the association.
b) Are the assumptions and conditions met for finding a correlation?
c) Using technology, find the correlation of the data when the car with the lowest carbon footprint and highest highway mpg is not included with the others. Explain why it changes in that way
Click the icon to view the data table.
C. There is a strong negative linear association.
D. There is a weak positive linear association.
E. There is a weak negative linear association.
b). Are the assumptions and conditions met for finding a correlation?
A. No, because the quantitative variables and linearity conditions have been met but the outlier condition has not been met.
B. No, because the outlier and linearity conditions have been met but
C. No because the quantitative variables and outlier conditions have been met but the linearity condition has not been met
D. Yes, because the quantitative variable, linearity and outlier conditions have all been met
c). The correlation with the point (44.5.9) removed is
Round to three decimal places as needed
Explain why it changes in that way. Choose the correct answer below.
A. Removing a point the follows the general trend of the data will often have almost no effect on the
Correlation.
B. Data values far from the main body of the data and not in line with the linear trend to increase the
strength of the correlation, so removing this point has the opposite effect.
C. Data values far from the main body of the data and not in line with the linear trend to increase the
strength of the correlation, so removing this point has the opposite effect.
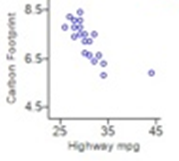

Carbon Footprint 8.5 6.5 45 25 35 Highway mog 45 Highway Carbon mpg Footprint 44 5.9 34 5.8 33 6.6 32 34 31 31 32 30 30 6.3 6.6 7.2 7.5 6.7 7.2 Full data set Highway Carbon mpg Footprint 30 7.5 29 7.5 29 7.8 8.1 29 28 28 28 29 26 27 7.4 7.8 8.1 8.4 7.8 8.2 22
Step by Step Solution
3.45 Rating (168 Votes )
There are 3 Steps involved in it
To answer your questions lets break them down Part a Describe the Association The given correlation is r 0763 Correlation Coefficient Interpretation A ... View full answer

Get step-by-step solutions from verified subject matter experts