

The Student Government Association at Middle Carolina University wanted to demonstrate the relationship between the number of
Question:
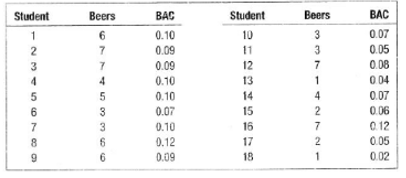
The Student Government Association at Middle Carolina University wanted to demonstrate the relationship between the number of beers a student drinks and their blood alcohol content (SAC). A random sample of 18 students participated in a study in which each participating student was randomly assigned a number of 12-ounce cans of beer to drink. Thirty minutes after consuming their assigned number of beers a member of the local sheriffs office measured their blood alcohol content The sample information is reported below.
Use a statistical software package to answer the following questions.
a. Develop a scatter diagram for the number of beers consumed and BAG. Coijuici it on the relationship. Does it appear to be strong or weak? Does it appear to be direct or inverse?
b. Determine the coefficient of correlation.
c. Determine the coefficient of determination
c. At the .01 significance level is it reasonable to conclude that there is a positive relationship in the population between the number of beers consumed and the BAG' V11"iat is the p-value7
Expert Answer:
a Let X be the number of beers consumed explanatory variable Let Y be the BAC response vanable Const... View the full answer


Statistical Techniques in Business and Economics
ISBN: 978-0078020520
16th edition
Authors: Douglas Lind, William Marchal
