

There are 2 initial diagrams, the left one represents a labor market, the right a production possibilities
Fantastic news! We've Found the answer you've been seeking!
Question:
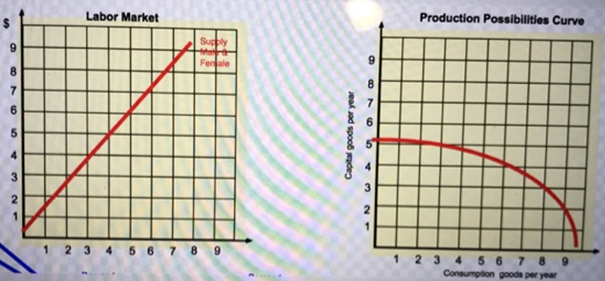
There are 2 initial diagrams, the left one represents a labor market, the right a production possibilities curve.
Click here to bring up a template on which to draw a graph to respond to the questions in this quiz.
Select the File/Copy commands in Google to make a copy of the graph in your Google Drive Account, than follow the below instructions to complete the graph:
1. In the left hand diagram represent wage discrimination, Locate the Wage discriminator demand curve so it crosses the Supply curve at the coordinates (4,5) and the Demand absent discrimination so it crosses the Supply curve at the coordinates (5,6).
Expert Answer:
In the lefthand side labor market the wage discrimination intersect coordinates ... View the full answer

Related Book For 

Posted Date:
