

Question: Use the data below to determine recurrence intervals for the river shown below. This river has had 29 fbods over the past 100 years. Some
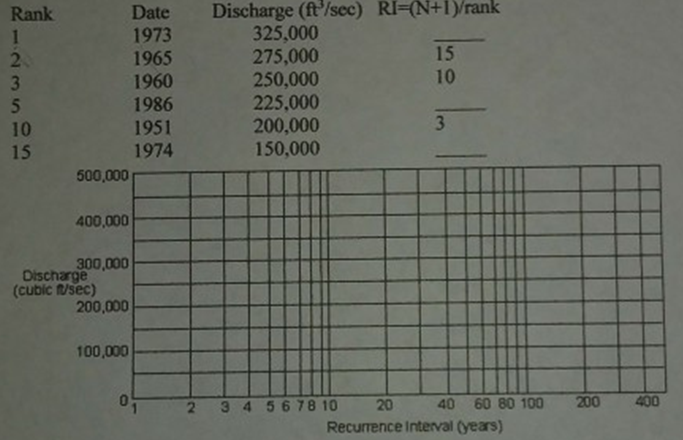
Use the data below to determine recurrence intervals for the river shown below. This river has had 29 fbods over the past 100 years. Some of the data are shown below in order by rank.
a. Complete the table below by calculating the remaining Recurrence Intervals. Plot the values on the graph, and draw a best fit line.
b. What is the predicted discharge for a 100 year flood event?
c. How often would you predict a 475,000 cfs flood would occur?
d. What is the likely discharge for a 20 year flood? e. What is the probability that a 20 year flood will occur this year for this river?
Rank 1 20 3 5 10 15 500,000 400,000 300,000 Discharge (cubic ft/sec) 200,000 100,000 Date 1973 1965 1960 1986 1951 1974 2 Discharge (ft/sec) RI=(N+1)/rank 325,000 275,000 250,000 225,000 200,000 150,000 15 10 3 4 5 6 78 10 3 20 Recurrence Interval (years) 40 60 80 100 200 400
Step by Step Solution
3.38 Rating (148 Votes )
There are 3 Steps involved in it
To address the given question follow these steps a Complete the table by calculating the remaining R... View full answer

Get step-by-step solutions from verified subject matter experts