

Question: Use the interaction diagrams in Appendix A to compute the maximum moment, Mu, that can be supported by the column shown in Fig. P11-11 if
Use the interaction diagrams in Appendix A to compute the maximum moment, Mu, that can be supported by the column shown in Fig. P11-11 if
(a) P u = 583 kips.
(b) P u = 130 kips.
(c) e = 4 in.
Use psi f' c = 5000 and f v = 60,000 psi.
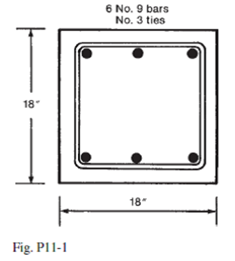
18- Fig. P11-1 6 No. 9 bars No. 3 ties 18"
Step by Step Solution
3.28 Rating (151 Votes )
There are 3 Steps involved in it
To solve this problem we have to analyze the given concrete column section using interaction diagrams to determine the maximum moment Mu for specified axial loads Pu Heres how to approach this Given Data Column dimensions 18 x 18 Reinforcement 6 No 9 bars Concrete compressive strength fc 5000 psi Steel yield strength fy 60000 psi Step 1 Calculate Reinforcement Area For 6 No 9 bars Area of one No 9 bar 100 textin2 Total steel area As 6 times 100 600 textin2 Step 2 Calculate the Gross Area of the Column Gross area Ag 18 times 18 324 textin2 Step 3 Interaction Diagram Usage Interaction diagrams relate axial load P and moment M for a given section Use the interaction diagram ... View full answer

Get step-by-step solutions from verified subject matter experts
Document Format (2 attachments)
608f78bfac07e_21077.pdf
180 KBs PDF File
608f78bfac07e_21077.docx
120 KBs Word File