

Using Figure 9.2, suppose P0 is $10 and P1 $11. Suppose a new firm with the same
Question:
Using Figure 9.2, suppose P0 is $10 and P1 $11. Suppose a new firm with the same LRAC curve as the incumbent tries to break into the market by selling 4,000 units of output. (Taylor & Greenlaw, 2014, p. 223).
Estimate from the graph what the new firm?s average cost of producing output would be.
If the incumbent continues to produce 6,000 units, how much output would be supplied to the market by the two firms?
Estimate what would happen to the market price as a result of the supply of both the incumbent firm and the new entrant.
Approximately how much profit would each firm earn? 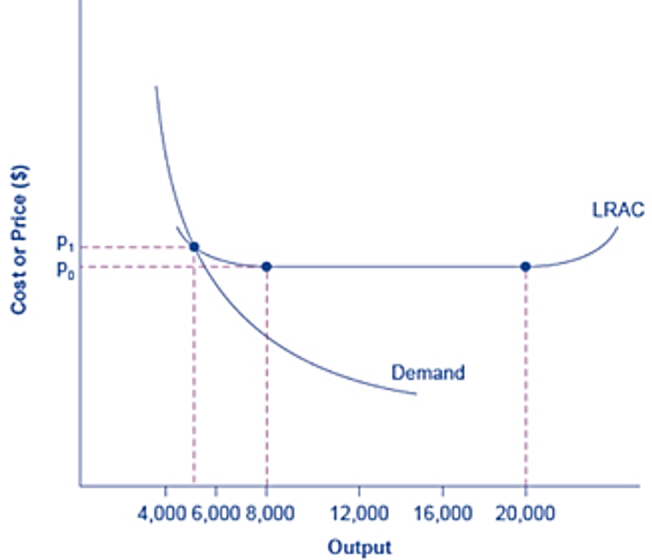
Figure 9.2 Economies of Scale and Natural Monopoly In this market, the demand curve intersects the long.run average cost (LRAC) curve at its downward-sloping part. A natural monopoly occurs when the quantity demanded is less than the minimum quantity it takes to be at the bottom of the long-run average cost curve.
Expert Answer:
From the given figure it can be seen that the points P 0 and P 1 corresponds to the LRAC curves according to the output given on the horizontal axis For example output level 5000 units corresponds to ... View the full answer


Finance Applications and Theory
ISBN: 978-0077861681
3rd edition
Authors: Marcia Cornett, Troy Adair
